
- Title
-
Synergistic prostaglandin E synthesis by myeloid and endothelial cells promotes fetal hematopoietic stem cell expansion in vertebrates
- Authors
- Cacialli, P., Mailhe, M.P., Wagner, I., Merkler, D., Golub, R., Bertrand, J.Y.
- Source
- Full text @ EMBO J.
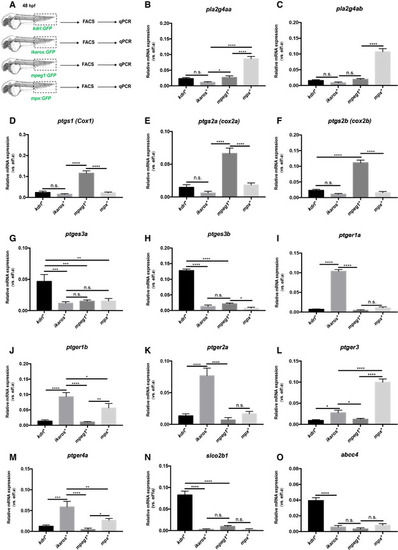
The PGE2 synthesis pathway in zebrafish CHT
Data information: For each panel, data represent biological triplicates plated in technical duplicates. Statistical analysis was completed using one‐way ANOVA and multiple comparison tests. *P < 0.05; **P < 0.01; ***P < 0.001; ****P < 0.0001. Center values denote the mean, and error bars denote s.e.m. Source data are available online for this figure. |
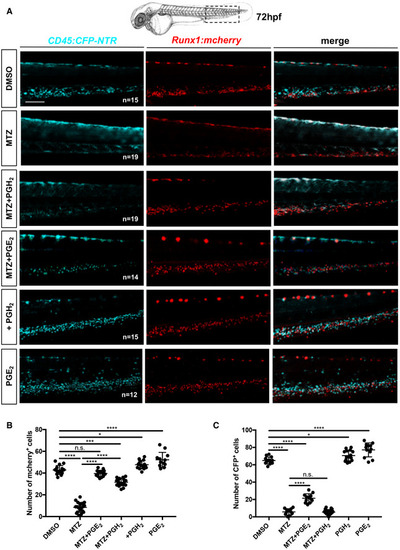
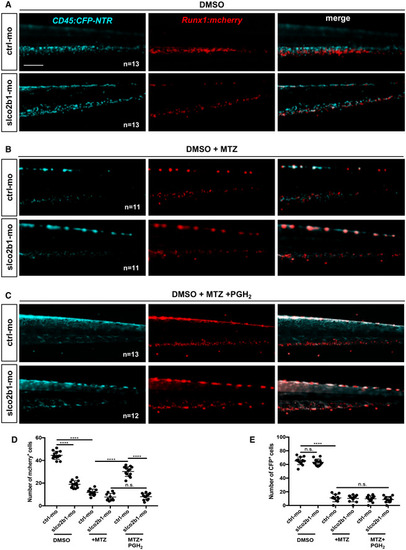
The loss of HSCs after myeloid ablation can be rescued by PGE2 or PGH2 treatments
Data information: Statistical analysis was completed using one‐way ANOVA and multiple comparison tests. *P < 0.05; **P < 0.01; ***P < 0.001; ****P < 0.0001. Scale bar is 200 μm (A). Source data are available online for this figure. EXPRESSION / LABELING:
PHENOTYPE:
|
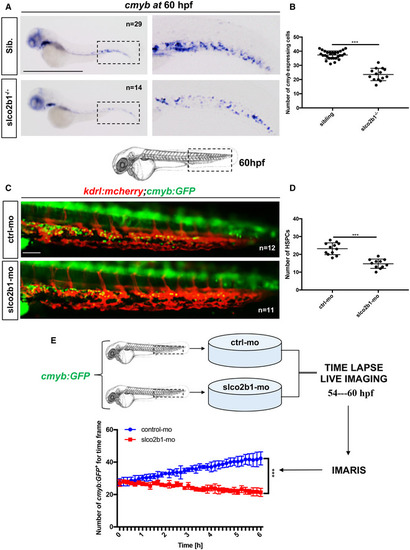
The deficiency of slco2b1 induces a decrease of HSPC in the CHT
Data information: Center values denote the mean, and error values denote s.e.m. The statistical analysis was completed using an unpaired two‐tailed t‐test. ***P < 0.001. Scale bar is 500 μm (A); 200 μm (C). Source data are available online for this figure. |
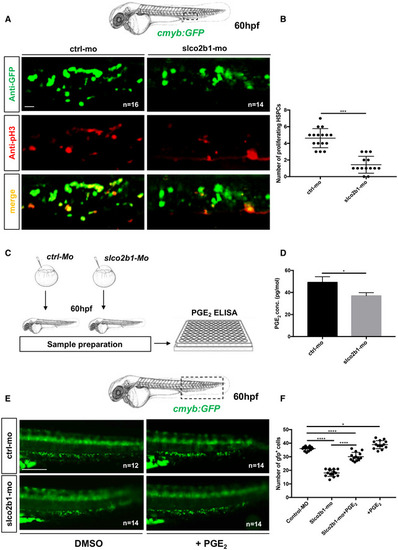
The defect in HSPCs proliferation in slco2b1‐deficient embryos can be rescued by PGE2 treatment
Source data are available online for this figure. |
Slco2b1 is necessary to import PGH2 into ECs
Scale bar is 200 μm (A–C). Source data are available online for this figure. EXPRESSION / LABELING:
PHENOTYPE:
|
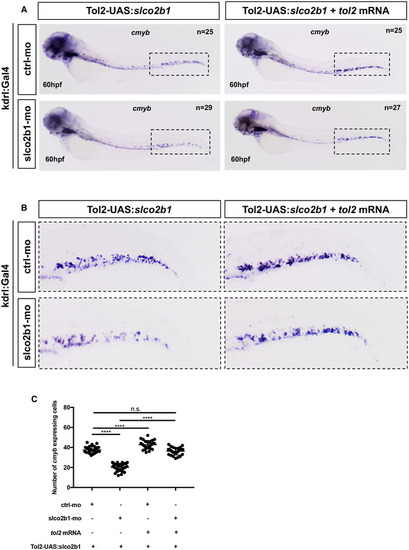
Slco2b1‐overexpression in ECs can rescue the loss of HSPCs in slco2b1‐ morphants
Source data are available online for this figure. PHENOTYPE:
|
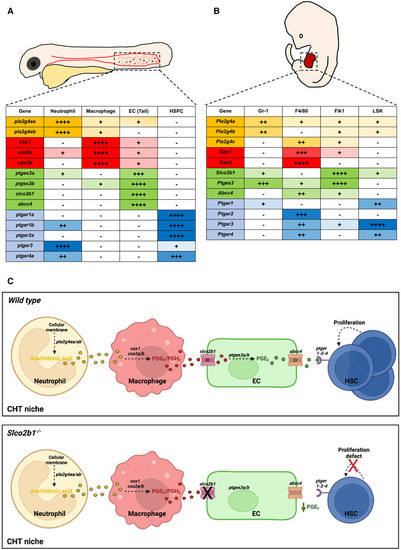
The expression of the prostaglandin synthesis pathway is conserved between the zebrafish CHT and the mouse fetal liver
Source data are available online for this figure. |
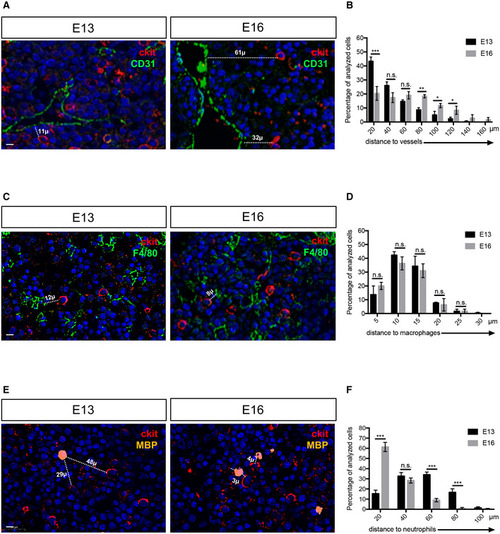
Myeloid and endothelial cells are very close to HSPCs in the mouse fetal liver
Data information: All nuclei were marked with DAPI. Scale bar is 20 μm (A–C–E). |