FIGURE

Fig. 8

ID
ZDB-FIG-221028-23
Publication
Cacialli et al., 2022 - Synergistic prostaglandin E synthesis by myeloid and endothelial cells promotes fetal hematopoietic stem cell expansion in vertebrates
Other Figures
All Figure Page
Back to All Figure Page
Fig. 8

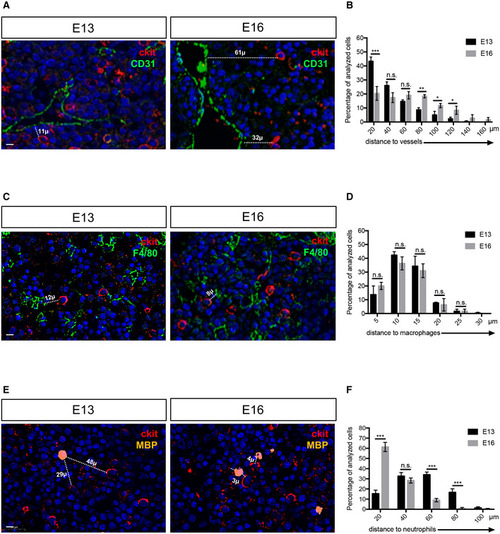
Myeloid and endothelial cells are very close to HSPCs in the mouse fetal liver

  • A
    Immunohistochemistry on paraffin sections for cKit (HSPCs marker) and CD31 (endothelial cell marker) at E13 and E16 stages of mouse fetal liver.
  • B
    Distance distribution between cKithigh cells and endothelial cells (n = 79 from three E13 fetal livers; n = 92 from three E16 fetal livers), binned into 20 μm intervals. Statistical analysis was completed using a t‐test. *P < 0.01; **P < 0.001; ***P < 0.0001. Center values denote the mean, and error values denote s.e.m.
  • C
    Immunohistochemistry on paraffin sections for cKit (HSPCs marker) and F4/80 (macrophage cell marker) at E13 and E16 stages of mouse fetal liver.
  • D
    Distance distribution between cKithigh cells and macrophages (n = 54 from three E13 fetal livers; n = 64 from three E16 fetal livers), binned into 5 μm intervals. Statistical analysis was completed using a t‐test.
  • E
    Immunohistochemistry on paraffin sections for cKit (HSPCs marker) and MBP (neutrophil cell marker) at E13 and E16 stages of mouse fetal liver.
  • F
    Distance distribution between cKithigh cells and neutrophils (n = 45 from three E13 fetal livers; n = 53 from three E16 fetal livers), binned into 20 μm intervals. Statistical analysis was completed using a t‐test ***P < 0.001.

Data information: All nuclei were marked with DAPI. Scale bar is 20 μm (A–C–E).

Expression Data

Expression Detail
Antibody Labeling
Phenotype Data

Phenotype Detail
Acknowledgments
This image is the copyrighted work of the attributed author or publisher, and ZFIN has permission only to display this image to its users. Additional permissions should be obtained from the applicable author or publisher of the image. Full text @ EMBO J.