- Title
-
Evaluation of okadaic acid toxicity in human retinal cells and zebrafish retinas
- Authors
- Tchivelekete, G.M., Almarhoun, M., Cao, Y., Zhou, X., Martin, P.E., Shu, X.
- Source
- Full text @ Toxicology
|
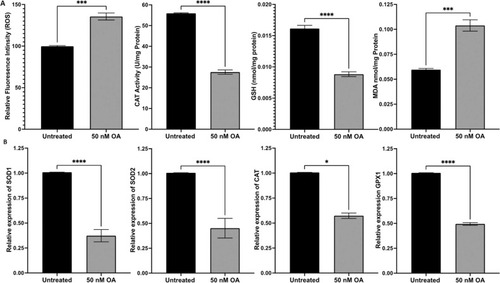
Fig. 1. OA induced effects on ROS production, CAT activity and the level of MDA as well as GSH. (A) ROS production was significantly increased in ARPE-19 cells exposed to OA compared to the untreated control group. CAT activity was significantly decreased in ARPE-19 cells treated with OA for 24 h. GSH level was markedly decreased, and MDA production was significantly increased in ARPE-19 cells treated with OA for 24 h. (B) ARPE-19 cells exposed to OA for 24 h had a significant decrease in antioxidant gene expression measured by qRT-PCR and normalized to the housekeeping gene, |
|
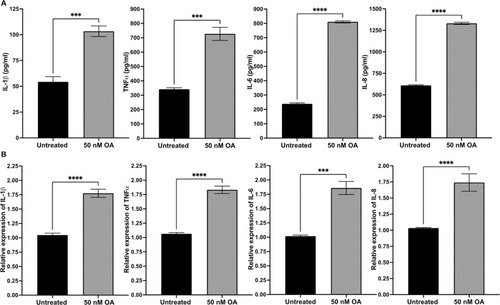
Fig. 2. OA induced overexpression of inflammation genes in ARPE-19 cells exposed for 24 h. (A) The protein concentrations of IL-1β, TNFα, IL-6 and IL, respectively, were measured by ELISA. (B) Quantification of IL1-β, TNFα, IL-6 and IL-8 mRNA in ARPE-19 cells treated with OA, measured by qRT-PCR and normalized to the housekeeping gene, GAPDH. Data was presented as mean ± SEM (n = 6). * *p < 0.01; * **p < 0.001; * ** *p < 0.0001. |
|
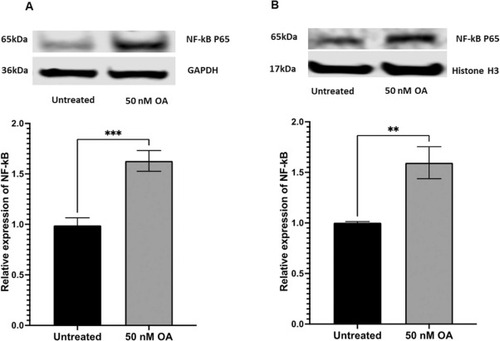
Fig. 3. ARPE-19 cells exposed to Okadaic acid for 24 h exhibited a significant increase in NF-kB protein levels, determined by Western blotting. (A) Representative Western blot image of NF-kB from the cytoplasmic protein normalized to GAPDH. (B) Representative Western blot image of NF-kB from the nuclear protein normalized to Histone H3. Data was presented as mean ± SEM (n = 6). * * p < 0.01; * ** p < 0.001. |
|
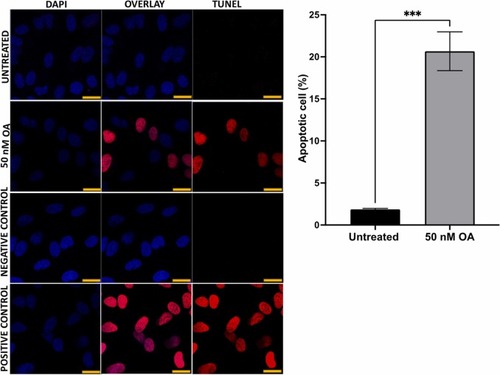
Fig. 4. ARPE-19 cells treated with 50 nM OA significantly increased apoptosis visualized by a TUNEL assay. (A) ARPE-19 cells, detected in different conditions, such as untreated, exposed to OA, negative control, and positive control treated with DNase. The samples were stained with TUNEL reagents (red) and co-stained with DAPI (blue) to detect apoptotic cells ; scale 10 µm (B) quantification of apoptotic cells by using 300 cells as a base and presented as a percentage ((number of apoptotic cells/300)× 100). Data was presented as mean ± SEM (n = 6). * ** p < 0.001. |
|
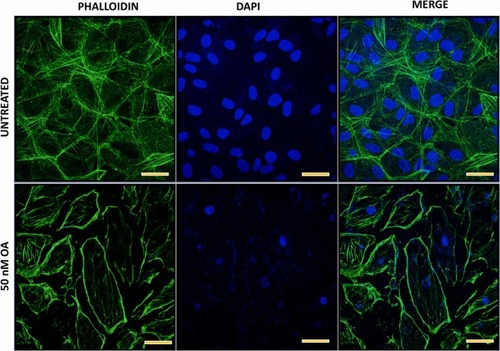
Fig. 5. ARPE-19 cells treated with 50 nM OA for 24 h exhibited a significant disruption in cytoskeleton compared to the untreated control cells. Cells were stained with phalloidin and visualized under confocal microscope to detect the filaments and DAPI for the nucleus visualization; Scale 20 µm. |
|
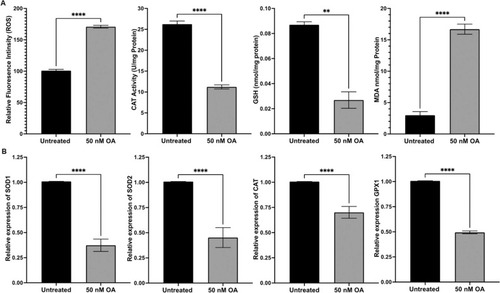
Fig. 6. OA induced effects on antioxidant capacity in zebrafish embryos. (A) ROS production was significantly increased in zebrafish embryos exposed to OA compared to the untreated control group. CAT activity was significantly decreased in zebrafish embryos treated with OA. Total GSH level was markedly decreased, and MDA production was significantly increased in zebrafish embryos treated with OA. (B) Zebrafish embryos exposed to OA had a significant decrease in expression of antioxidant genes at mRNA levels, measured by qRT-PCR and normalized to the housekeeping gene, GAPDH. Data was presented as mean ± SEM (n = 6). * *p < 0.01; * ** *p < 0.0001. |
|
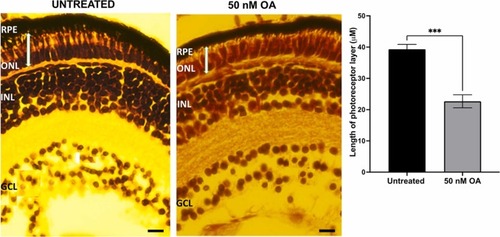
Fig. 7. Haemotoxylin and Eosin (H&E) stained retinal sections of zebrafish embryos untreated and treated with 50 nM OA from 24 to 120hpf. The thickness of the photoreceptor layer (between the RPE layer and the outer plexiform layer, labelled using a white bar) of control and exposed embryos were measured using Image J software. For each condition, the data were collected by measuring five images from sections from four eyes. Data was presented as mean ± SEM (n = 5). * ** p < 0.001. GCL, ganglion cell layer; INL, inner nuclear layer; ONL, outer nuclear layer; RPE, retinal pigment epithelium. Scale bar, 40 µm. PHENOTYPE:
|
|
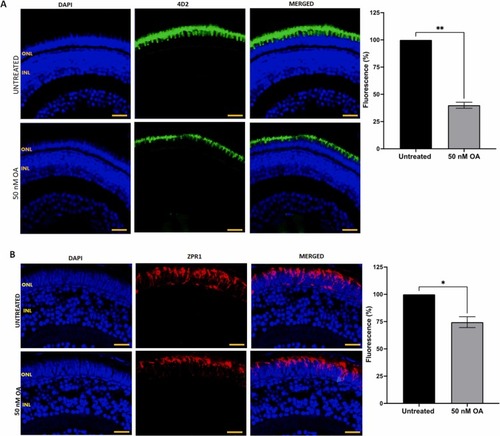
Fig. 8. (A) Detection of rod cells visualization by immunostaining with anti-rhodopsin 4D2 antibody in zebrafish embryos treated with or without 50 nM OA from 24 to 120 hpf. (B) Cone cells were detected by immunostaining with ZPR-1 antibody in retinal sections of zebrafish embryos treated with or without 50 nM OA from 24 to 120hpf. Embryos exposed to OA illustrated a reduction in fluorescence intensity. Five images were taken from untreated and treated zebrafish retinal sections and quantified using Image J software. Data was presented as mean ± SEM (n = 5). * p < 0.05; * * p < 0.01. Scale bar, 20 µm. |

