
Image
|
Figure Caption
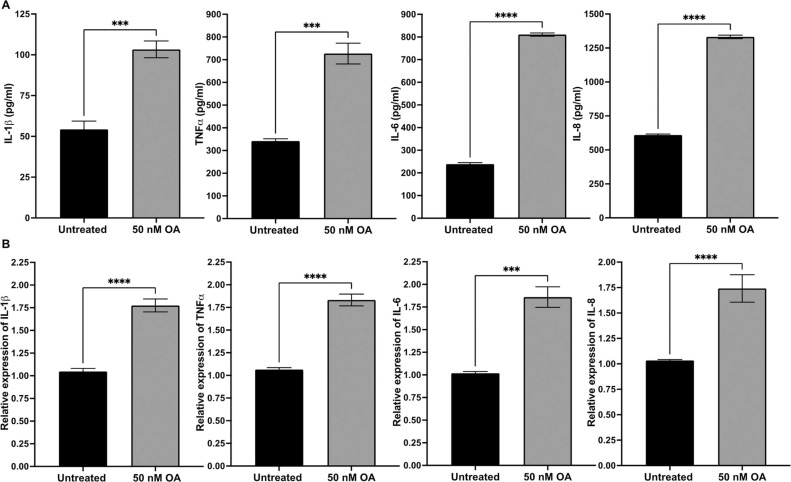
Fig. 2 Fig. 2. OA induced overexpression of inflammation genes in ARPE-19 cells exposed for 24 h. (A) The protein concentrations of IL-1β, TNFα, IL-6 and IL, respectively, were measured by ELISA. (B) Quantification of IL1-β, TNFα, IL-6 and IL-8 mRNA in ARPE-19 cells treated with OA, measured by qRT-PCR and normalized to the housekeeping gene, GAPDH. Data was presented as mean ± SEM (n = 6). * *p < 0.01; * **p < 0.001; * ** *p < 0.0001.
Acknowledgments
This image is the copyrighted work of the attributed author or publisher, and
ZFIN has permission only to display this image to its users.
Additional permissions should be obtained from the applicable author or publisher of the image.
Full text @ Toxicology