Image
Figure Caption
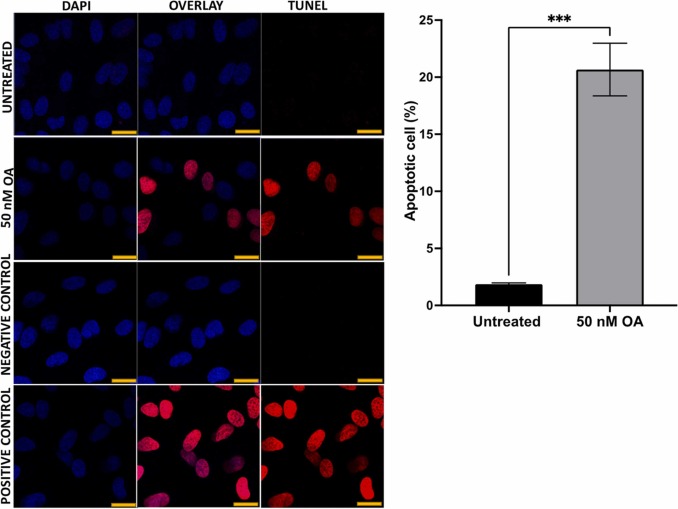
Fig. 4 Fig. 4. ARPE-19 cells treated with 50 nM OA significantly increased apoptosis visualized by a TUNEL assay. (A) ARPE-19 cells, detected in different conditions, such as untreated, exposed to OA, negative control, and positive control treated with DNase. The samples were stained with TUNEL reagents (red) and co-stained with DAPI (blue) to detect apoptotic cells ; scale 10 µm (B) quantification of apoptotic cells by using 300 cells as a base and presented as a percentage ((number of apoptotic cells/300)× 100). Data was presented as mean ± SEM (n = 6). * ** p < 0.001.
Acknowledgments
This image is the copyrighted work of the attributed author or publisher, and
ZFIN has permission only to display this image to its users.
Additional permissions should be obtained from the applicable author or publisher of the image.
Full text @ Toxicology

