
- Title
-
Tollip-deficient zebrafish display no abnormalities in development, organ morphology or gene expression in response to lipopolysaccharide
- Authors
- Wolińska-Nizioł, L., Romaniuk, K., Wojciechowska, K., Surga, K., Kamaszewski, M., Szudrowicz, H., Miączyńska, M.
- Source
- Full text @ FEBS Open Bio
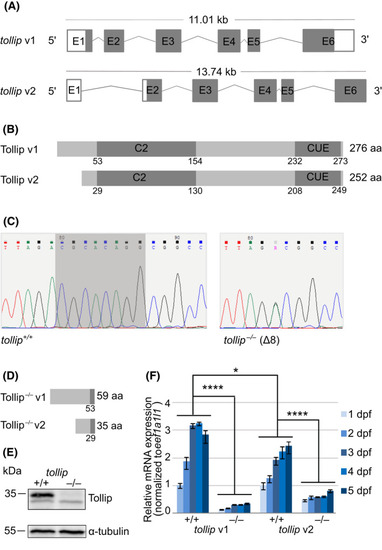
CRISPR/Cas9‐based genome editing allows for the generation of a Tollip‐deficient zebrafish line. (A) Schemes of the zebrafish tollip transcript variants 1 and 2 (v1 and v2), based on the Ensembl database, showing exons (E), translated sequences (gray), and UTR regions (white). (B) Schematic illustration of the structure of Tollip protein isoforms with the C2 and CUE domains indicated. (C) Partial DNA sequence of the target site within exon 2 of the tollip gene in wild‐type tollip+/+ fish (left) and homozygous tollip −/− knockout fish (right). Deletion of eight nucleotides observed in the mutant line is shadowed in dark gray. There is an additional nucleotide change flanking the deletion (double peak marked R in the chromatogram, corresponding to A or G, with a predicted amino acid change D to G in the truncated protein product), indicating mosaicism of the generated line. (D) Schematic illustration of the predicted structure of Tollip protein isoforms synthesized from the mutated tollip gene. (E) Western blot of the 5 dpf protein lysates from the wild‐type (tollip +/+) line and tollip −/− siblings. Top panel shows Tollip (~ 35 kDa) and a bottom panel shows α‐tubulin (~ 55 kDa) signal. (F) qPCR analysis of the expression of tollip transcripts during early zebrafish development (1–5 dpf). Bars represent the means ± SEM from 3–4 independent experiments (encompassing a pool of 10 larvae/condition). Mann–Whitney U test, *P < 0.05, ****P < 0.0001. |
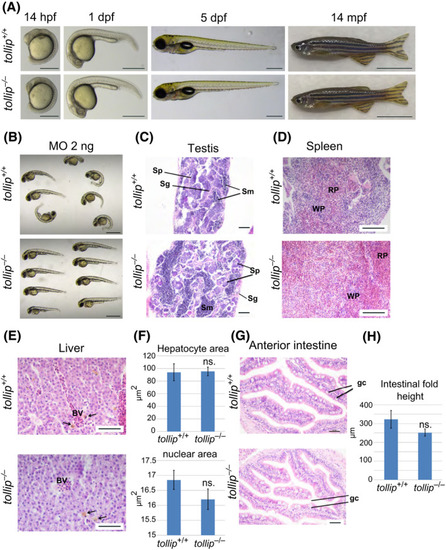
Knockout of the tollip gene has no effect on the fish morphology. (A) Wild‐type (tollip +/+) and mutant (tollip −/−) embryos at 14 h, and 1 and 5 days post fertilization (hpf, dpf) show normal development and morphology. Scale bar 500 μm. Right image, wild‐type (tollip +/+) and mutant (tollip −/−) male adults at 14 mpf are without visible body morphological defects. Scale bar 1 cm. (B) Morphology of wild‐type tollip +/+ and mutant tollip −/− embryos injected with 2 ng of translation‐blocking morpholino targeting tollip (MO), observed at 48 hpf. Scale bar 1 mm. (C–H) Histology and quantitative analysis of hematoxylin and eosin stained sections of testes (C), spleen (D), liver (E, F), and anterior intestine (G, H) with specific cells and structures marked, including spermatozoa (Sm), spermatogonia (Sg), spermatocytes (Sp), red pulp (RP), white pulp (WP), blood vessels (BV), liver macrophages (arrows in E), and goblet cells (gc). For liver analyses, areas of hepatocytes and their nuclei are quantified in F. The height of intestinal folds is quantified in H. Scale bar 50 µm (C, G), 100 µm (D, E). Bars represent the means ± SEM (n = 3, each encompassing 40–60 (liver) or 25 (intestine) measurements from 5 selected areas) t‐test, ns.—nonsignificant. PHENOTYPE:
|
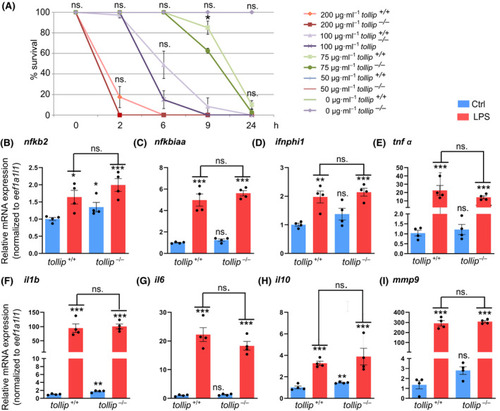
The expression of inflammatory mediators and regulators in response to LPS is largely normal in Tollip‐deficient larvae. (A) 24‐h LPS treatment induces the mortality in mutant and wild‐type larvae (3–4 dpf) in a dose‐dependent manner (an average of 4 experiments, 10 larvae per condition). (B–I) 6‐h exposure to LPS (75 µg·mL−1) induces expression of genes encoding NF‐κB components (nfkb2, nfkbiaa), interferon (ifnphi1), proinflammatory cytokines (tnfα, il1b, il6), anti‐inflammatory cytokine (il10), and matrix metalloproteinase mmp9 in wild‐type and tollip−/− 3 dpf larvae. Each dot represents data from one independent experiment (encompassing a pool of 10 larvae/condition), whereas bars represent the means ± SEM from n = 4 experiments. (A) Mann–Whitney U test, *P = 0.571; (B–I) ANOVA after log‐transforming the data, followed by Dunnett’s post hoc test, ns.—nonsignificant, *P < 0.01; **P < 0.005; ***P < 0.001. EXPRESSION / LABELING:
PHENOTYPE:
|

Deficiency of Tollip does not worsen the phenotypic hallmarks of Gaucher disease in the zebrafish model. (A) The general phenotype of zebrafish adults (3 mpf) of the examined mutant genotypes (tollip +/+/gba1 −/−; tollip −/−/gba1 +/+; tollip −/−/gba1 −/−), compared to the wild‐type genotype (tollip +/+/gba1 +/+). Scale bar 1 cm. (B) Swimming velocity examined in the mutant and wild‐type lines. Data are averaged within the tested groups, triangles indicate individual fish (n = 8 for the tollip +/+/gba1 +/+, tollip +/+/gba1 −/−, tollip −/−/gba1+/+/ groups, n = 10 for the tollip −/−/gba1 −/− group) and the error bars represent SEM. t‐test, ns.—nonsignificant, **P < 0.005, ***P < 0.001. PHENOTYPE:
|