
- Title
-
Tel2 regulates redifferentiation of bipotential progenitor cells via Hhex during zebrafish liver regeneration
- Authors
- Zhang, J., Zhou, Y., Li, S., Mo, D., Ma, J., Ni, R., Yang, Q., He, J., Luo, L.
- Source
- Full text @ Cell Rep.
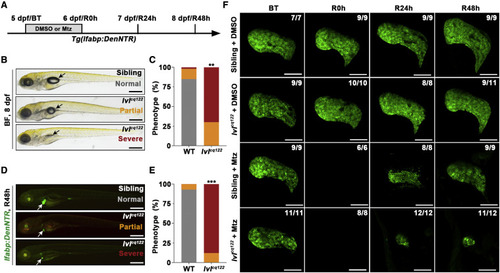
Figure 1. Liver regeneration is impaired in the lvl mutant (A) Experimental schematic illustrating the stages of Mtz treatment and analysis at BT, R0h, R24h, and R48h. (B) Bright-field (BF) images showing the body phenotype of sibling and lvl larvae at R48h. The lvl mutant embryos exhibit partial or severe deficiency of the swim bladder (arrows). (C) Quantification of the phenotypic proportion of the swim bladder in sibling and lvl in (B); n = 50 larvae. ∗∗p < 0.01 by t test. (D) Epifluorescence images showing lfabp:DenNTR expression (green) of sibling and lvl mutant treated with Mtz at R48h. Arrows point to the liver. (E) Quantification of the phenotypic proportion of lfabp:DenNTR expression at R48h in (D); n = 50 larvae. ∗∗∗p < 0.001 by t test. (F) Confocal projection images showing liver development and regenerating livers after Mtz treatment in sibling and lvl mutant from BT to R48h. Numbers indicate the proportion of larvae exhibiting the phenotype shown. Scale bars, 100 μm (F) and 400 μm (B and D). BT, before Mtz treatment. See also Figure S1. |
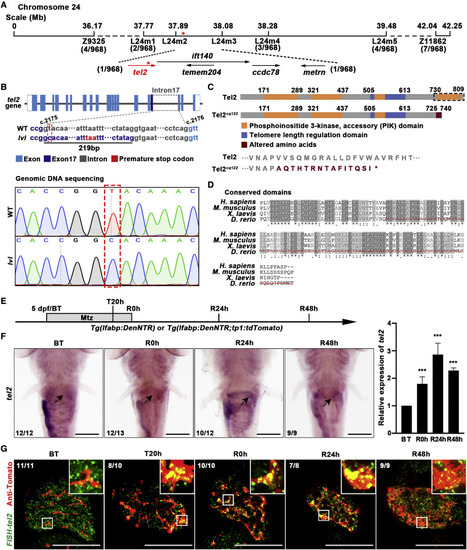
Figure 2. tel2 is the candidate gene of the lvl mutant (A) Genetic map of the candidate region on chromosome 24. Numbers below SSLP markers indicate recombination events. (B) Top panel: diagram showing the genomic structure of tel2. Bottom panel: sequencing result showing the DNA sequence change in lvl. A T-to-C transversion (red dashed box) was positioned in the pre-mRNA splice site of tel2 intron 17 (between coding DNA nucleotides 2,175 and 2,176), leading to the 219-bp insertion and introducing a premature stop codon in the coding region. (C) Top panel: schematic showing the difference of function domains (black dashed box) in Tel2 between the wild type (WT) and lvl. Bottom panel: the protein sequence change in the lvl mutant. (D) Zebrafish Tel2 and its homologous proteins in human, mouse, and Xenopus, showing a highly conserved phosphatidylinositol 3-kinase (PI3K) function domain. The red dashed line represents mutated amino acids in lvl. (E) Experimental schematic illustrating the stages of Mtz treatment and analysis at BT, T20h, R0h, R24h, and R48h. (F) Whole-mount in situ hybridization (WISH) images showing tel2 expression in the liver region (arrows) and quantitative real-time PCR showing the relative expression level of tel2 in regenerating livers from BT to R48h. n = 3 technical replicates. Values represent means ± SD. ∗∗∗p < 0.001 by t test. (G) Fluorescence in situ hybridization (FISH) and antibody staining in regenerating livers showing expression of tel2 (green) in Tp1+ cells (red). Expression of tel2 was upregulated from T20h and up to the maximal level at R24h. Numbers indicate the proportion of larvae exhibiting the expression shown. Scale bars, 100 μm (F and G). See also Figure S2. |
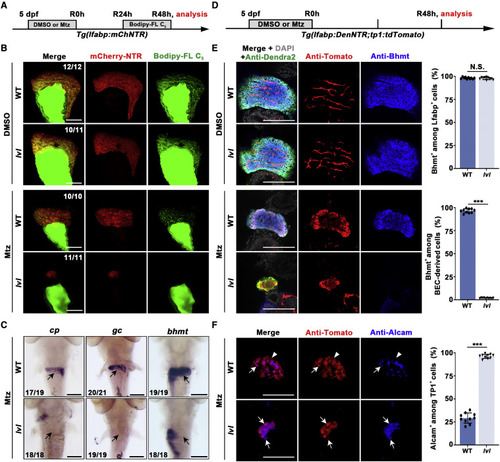
Figure 3. tel2 mutation blocks redifferentiation of BP-PCs (A) Experimental schematic illustrating BODIPY FL C5 and Mtz treatment and analysis at R48h. (B) Confocal projection images showing the double labels of mCherry-NTR (red) and BODIPY FL C5 (green) in regenerating livers of WT and lvl at R48h with control (top panel) and Mtz treatment (bottom panel). (C) WISH images showing the expression of cp, gc, and bhmt in regenerating livers at R48h in WT and lvl larvae. Arrows point to the liver region. (D) Experimental schematic illustrating Mtz treatment and analysis at R48h. (E) Single optical section images showing Dendra2-NTR (green), Tomato (red), Bhmt (blue), and DAPI (gray) expression in regenerating livers of the WT and lvl at R48h with control (top panel) and Mtz treatment (bottom panel). Quantification of the percentage of Bhmt+ among Lfabp+ and BEC-derived cells is shown. n = 10 larvae. Values represent means ± SD. ∗∗∗p < 0.001 by t test; N.S., no significant difference. (F) Single optical section images showing Tomato (red) and Alcam (blue) expression in regenerating livers at R48h in the WT and lvl. Arrows point to Tp1+/Alcam+ cells; arrowheads point to Tp1+/Alcam− cells. Quantification of the percentage of Alcam+ among Tp1+ cells is shown. n = 10 larvae. Values represent means ± SD. ∗∗∗p < 0.001 by t test. Numbers indicate the proportion of larvae exhibiting the expression shown. Scale bars, 100 μm (B, C, E, and F). See also Figure S3. |
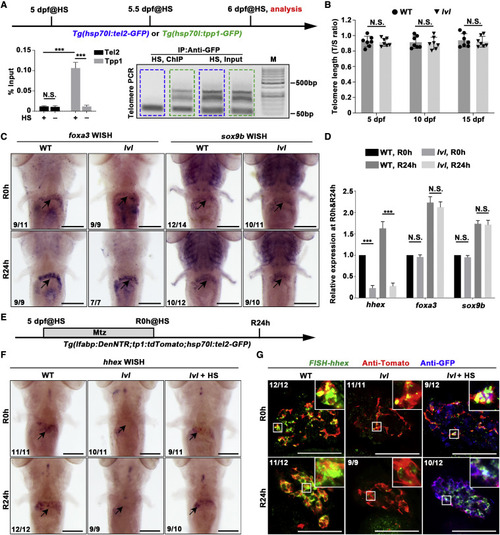
Figure 4. Tel2 regulates transcription of hhex in BECs and BEC-derived cells during liver regeneration independent of telomere-related function (A) Experimental schematic illustrating the stages of heat shock (HS) treatment and analysis at 6 dpf. Tg(hsp70l:tel2-GFP) and Tg(hsp70l:tpp1-GFP) were used to generate Tel2-GFP and Tpp1-GFP by HS. Binding of Tel2 or Tpp1 to telomere DNA was measured by chromatin immunoprecipitation (ChIP) with or without HS. Quantitative real-time PCR data show telomere DNA enrichment following ChIP with an antibody against GFP. Agarose gel electrophoresis of ChIP-PCR shows the physical interaction between Tel2-GFP (blue dashed box), Tpp1-GFP (green dashed box), and telomere DNA. Note the UV transillumination as a smear beginning at 76 bp (the dimer length of the two primers) and fading to background at ∼500 bp; there was no detectable telomere DNA in the product of ChIP with anti-GFP in hsp70l:Tel2-GFP. n = 3 technical replicates. Values represent means ± SD. ∗∗∗p < 0.001 by t test. (B) Quantitative real-time PCR data showing relative telomere length measured by single-copy gene (T/S) ratio in the WT and lvl from 5–15 dpf. n = 7 larvae. Values represent means ± SD. (C) WISH images showing expression of foxa3 and sox9b in regenerating livers at R0h and R24h in the WT and lvl. Arrows point to the liver region. (D) Quantitative real-time PCR data showing the relative expression levels of hhex, foxa3, and sox9b at R0h and R24h in the WT and lvl. n = 3 technical replicates. Values represent means ± SD. ∗∗∗p < 0.001 by t test. (E) Experimental schematic illustrating Mtz and HS treatment and analysis at R0h and R24h. (F) WISH images showing expression of hhex in regenerating livers at R0h and R24h. Arrows point to the liver region. (G) FISH and antibody staining showing expression of hhex (green), Tomato (red), and Tel2-GFP (blue) at R0h and R24h. The expression level of hhex was severely downregulated in BEC-derived cells but rescued by Tel2 overexpression in lvl. Numbers indicate the proportion of larvae exhibiting the phenotype shown. Scale bars, 100 μm (C, F, and G). See also Figure S4. PHENOTYPE:
|
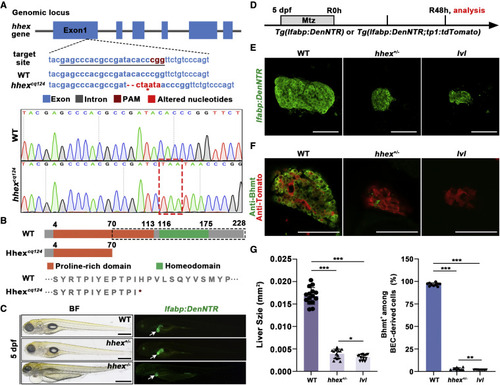
Figure 5. hhex+/− heterozygotes show liver regeneration defects similar to lvl (A) The genomic structure of hhex (top panel) and the guide RNA (gRNA) target sequence in hhex exon 1 (center panel). Bottom panel: sequence alignment showing the 2-bp deletion and 6-bp addition containing a premature stop codon (red asterisk/dashed box) in the hhexcq124 mutant. (B) Top panel: schematic showing the function domain change (black dashed box) of Hhex in the WT and hhexcq124 mutant. Bottom panel: the protein sequence change in the hhexcq124 mutant. (C) BF and epifluorescence images showing the body phenotypes of WT sibling, heterozygous mutant (+/−), and homozygous (−/−) mutant at 5 dpf (n = 25–27 larvae). hhex−/− mutants exhibit severe defects in multiple organs, including the liver, but hhex+/− mutants commonly survive without noticeable flaws. Arrows point to the liver. (D) Experimental schematic illustrating Mtz treatment and analysis at R48h. (E) Confocal projection images showing regenerating livers of WT, hhex+/−, and lvl at R48h. (F) Single optical section images showing Tomato (red) and Bhmt (green) expression in regenerating livers of WT, hhex+/−, and lvl at R48h. (G) Graph showing quantification of liver size shown in (E) (n = 15 larvae) and the percentage of Bhmt+ among BEC-derived cells shown in (F) (n = 10 larvae). Values represent means ± SD. ∗p < 0.05, ∗∗p < 0.01, ∗∗∗p < 0.001 by t test. Scale bars, 100 μm (E and F) and 400 μm (C). See also Figure S5. |
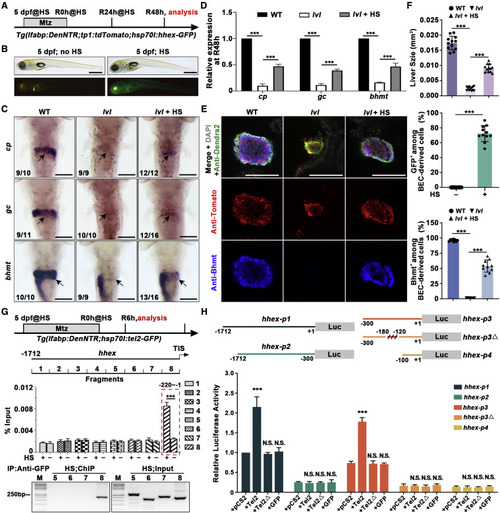
Figure 6. Redifferentiation of BP-PCs regulated by Tel2 is partially mediated via Hhex (A) Experimental schematic illustrating the stages of Mtz and HS treatment and analysis at R48h. (B) BF and epifluorescence images showing normal body phenotypes, and the whole-mount overexpression of Hhex-GFP was induced upon HS. (C) WISH images showing expression of cp, gc, and bhmt at R48h. Arrows point to the liver region. (D) Quantitative real-time PCR data showing relative expression levels of cp, gc, and bhmt in WT, lvl, and hhex-overexpressed lvl regenerating livers at R48h. n = 3 technical replicates. Values represent means ± SD. ∗∗∗p < 0.001 by t test. (E) Single optical section images showing Dendra2-NTR (green), Tomato (red), Bhmt (blue), and DAPI (gray) expression in regenerating livers at R48h. Bhmt expression in BEC-derived cells of lvl was rescued by Hhex-GFP overexpression. (F) Graph showing quantification of liver size and percentage of GFP+ or Bhmt+ among BEC-derived cells shown in (E); n = 10–12 larvae. Values represent means ± SD. ∗∗∗p < 0.001 by t test. (G) Top panel: experimental schematic illustrating the stages of HS treatment and analysis at R6h. Tg(hsp70l:tel2-GFP) was used to generate Tel2-GFP by HS. Binding of Tel2 to the putative hhex promoter was measured by ChIP assays with or without HS using a GFP antibody. Eight pairs of specific primers for hhex promoter regions (−1 to −1712 bp) were designed to amplify 8 DNA fragments covering the promoter sequences of hhex-1.7 kb. Center panel: quantitative real-time PCR showing DNA fragments enrichment following ChIP. Bottom panel: agarose gel electrophoresis of ChIP-PCR showing the interaction between Tel2-GFP and DNA fragments. n = 3 technical replicates. Values represent means ± SD. ∗∗∗p < 0.001 by t test. (H) Top panel: the hhex promoter, hhex-p1 (−1 to −1712 bp), hhex-p2 (−300 to −1712 bp), hhex-p3 (−1 to −300 bp), hhex-p3Δ (deleted −120 to −180 bp), and hhex-p4 (−1 to −100 bp) were cloned to the pGL3 vector. Bottom panel: luciferase activity assays showing that Tel2, but not lvl mutated protein (Tel2Δ) or GFP, activated the transcriptional activity of hhex-p1 but not hhex-p2 and that the sequences between −120 and −180 in hhex-p3 harbored the Tel2-responsive elements. n = 3 technical replicates. Values represent means ± SD. ∗∗∗p < 0.001 by t test. Numbers indicate the proportion of larvae exhibiting the phenotype shown. Scale bars, 100 μm (C and E) and 400 μm (B). TIS, translation initiation site. See also Figure S6. |
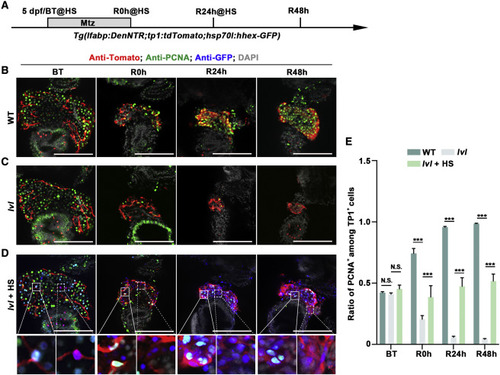
Figure 7. Proliferation of BP-PCs regulated by Tel2 is partially mediated via Hhex (A) Experimental schematic illustrating the stages of Mtz and HS treatment and analysis at BT, R0h, R24h, and R48h. (B and C) Single optical section images showing Tomato (red), PCNA (green), and DAPI (gray) expression at BT, R0h, R24h, and R48h in the WT (B) and lvl (C). (D) Single optical section images showing Tomato (red), PCNA (green), Hhex-GFP (blue), and DAPI (gray) expression at BT, R0h, R24h, and R48h in lvl with HS treatment. (E) Quantification of the percentage of PCNA+ among Tp1+ cells from BT to R48h. The proliferation rate of PCNA+ cells was decreased from R0h and fell to the minimal level at R24h in lvl, whereas the reduction was ameliorated by Hhex overexpression. n = 7–8 larvae. Values represent means ± SD. ∗∗∗p < 0.001 by t test. Scale bars, 100 μm (B–D). See also Figure S7. |

ZFIN is incorporating published figure images and captions as part of an ongoing project. Figures from some publications have not yet been curated, or are not available for display because of copyright restrictions. |