
Fig. 3
- ID
- ZDB-IMAGE-220805-23
- Genes
- Antibodies
- Publication
- Zhang et al., 2022 - Tel2 regulates redifferentiation of bipotential progenitor cells via Hhex during zebrafish liver regeneration
- All Figures
- Figures for Zhang et al., 2022
|
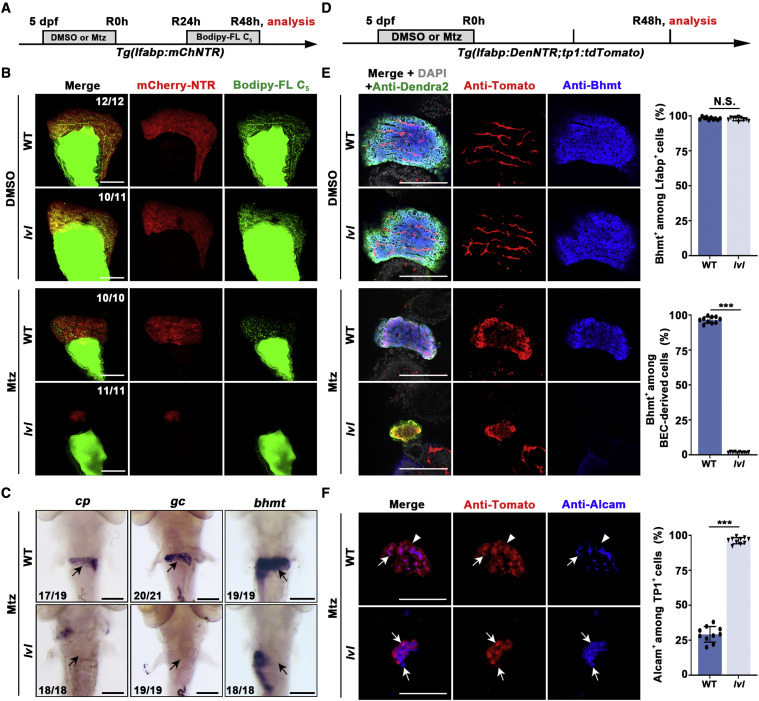
Fig. 3 Figure 3. tel2 mutation blocks redifferentiation of BP-PCs (A) Experimental schematic illustrating BODIPY FL C5 and Mtz treatment and analysis at R48h. (B) Confocal projection images showing the double labels of mCherry-NTR (red) and BODIPY FL C5 (green) in regenerating livers of WT and lvl at R48h with control (top panel) and Mtz treatment (bottom panel). (C) WISH images showing the expression of cp, gc, and bhmt in regenerating livers at R48h in WT and lvl larvae. Arrows point to the liver region. (D) Experimental schematic illustrating Mtz treatment and analysis at R48h. (E) Single optical section images showing Dendra2-NTR (green), Tomato (red), Bhmt (blue), and DAPI (gray) expression in regenerating livers of the WT and lvl at R48h with control (top panel) and Mtz treatment (bottom panel). Quantification of the percentage of Bhmt+ among Lfabp+ and BEC-derived cells is shown. n = 10 larvae. Values represent means ± SD. ∗∗∗p < 0.001 by t test; N.S., no significant difference. (F) Single optical section images showing Tomato (red) and Alcam (blue) expression in regenerating livers at R48h in the WT and lvl. Arrows point to Tp1+/Alcam+ cells; arrowheads point to Tp1+/Alcam− cells. Quantification of the percentage of Alcam+ among Tp1+ cells is shown. n = 10 larvae. Values represent means ± SD. ∗∗∗p < 0.001 by t test. Numbers indicate the proportion of larvae exhibiting the expression shown. Scale bars, 100 μm (B, C, E, and F). See also Figure S3.