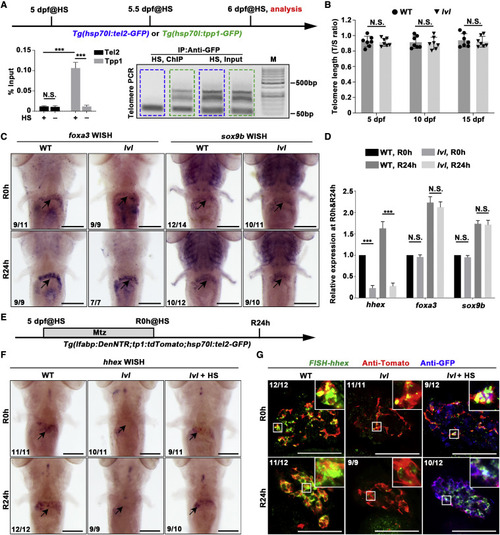
Figure 4. Tel2 regulates transcription of hhex in BECs and BEC-derived cells during liver regeneration independent of telomere-related function (A) Experimental schematic illustrating the stages of heat shock (HS) treatment and analysis at 6 dpf. Tg(hsp70l:tel2-GFP) and Tg(hsp70l:tpp1-GFP) were used to generate Tel2-GFP and Tpp1-GFP by HS. Binding of Tel2 or Tpp1 to telomere DNA was measured by chromatin immunoprecipitation (ChIP) with or without HS. Quantitative real-time PCR data show telomere DNA enrichment following ChIP with an antibody against GFP. Agarose gel electrophoresis of ChIP-PCR shows the physical interaction between Tel2-GFP (blue dashed box), Tpp1-GFP (green dashed box), and telomere DNA. Note the UV transillumination as a smear beginning at 76 bp (the dimer length of the two primers) and fading to background at ∼500 bp; there was no detectable telomere DNA in the product of ChIP with anti-GFP in hsp70l:Tel2-GFP. n = 3 technical replicates. Values represent means ± SD. ∗∗∗p < 0.001 by t test. (B) Quantitative real-time PCR data showing relative telomere length measured by single-copy gene (T/S) ratio in the WT and lvl from 5–15 dpf. n = 7 larvae. Values represent means ± SD. (C) WISH images showing expression of foxa3 and sox9b in regenerating livers at R0h and R24h in the WT and lvl. Arrows point to the liver region. (D) Quantitative real-time PCR data showing the relative expression levels of hhex, foxa3, and sox9b at R0h and R24h in the WT and lvl. n = 3 technical replicates. Values represent means ± SD. ∗∗∗p < 0.001 by t test. (E) Experimental schematic illustrating Mtz and HS treatment and analysis at R0h and R24h. (F) WISH images showing expression of hhex in regenerating livers at R0h and R24h. Arrows point to the liver region. (G) FISH and antibody staining showing expression of hhex (green), Tomato (red), and Tel2-GFP (blue) at R0h and R24h. The expression level of hhex was severely downregulated in BEC-derived cells but rescued by Tel2 overexpression in lvl. Numbers indicate the proportion of larvae exhibiting the phenotype shown. Scale bars, 100 μm (C, F, and G). See also Figure S4.
|
