|
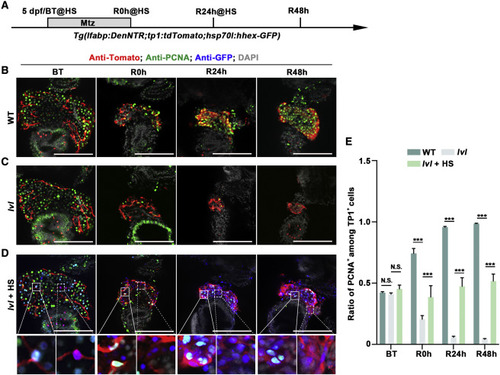
Figure 7. Proliferation of BP-PCs regulated by Tel2 is partially mediated via Hhex (A) Experimental schematic illustrating the stages of Mtz and HS treatment and analysis at BT, R0h, R24h, and R48h. (B and C) Single optical section images showing Tomato (red), PCNA (green), and DAPI (gray) expression at BT, R0h, R24h, and R48h in the WT (B) and lvl (C). (D) Single optical section images showing Tomato (red), PCNA (green), Hhex-GFP (blue), and DAPI (gray) expression at BT, R0h, R24h, and R48h in lvl with HS treatment. (E) Quantification of the percentage of PCNA+ among Tp1+ cells from BT to R48h. The proliferation rate of PCNA+ cells was decreased from R0h and fell to the minimal level at R24h in lvl, whereas the reduction was ameliorated by Hhex overexpression. n = 7–8 larvae. Values represent means ± SD. ∗∗∗p < 0.001 by t test. Scale bars, 100 μm (B–D). See also Figure S7.
|