
Fig. 6
- ID
- ZDB-IMAGE-220805-26
- Genes
- Publication
- Zhang et al., 2022 - Tel2 regulates redifferentiation of bipotential progenitor cells via Hhex during zebrafish liver regeneration
- All Figures
- Figures for Zhang et al., 2022
|
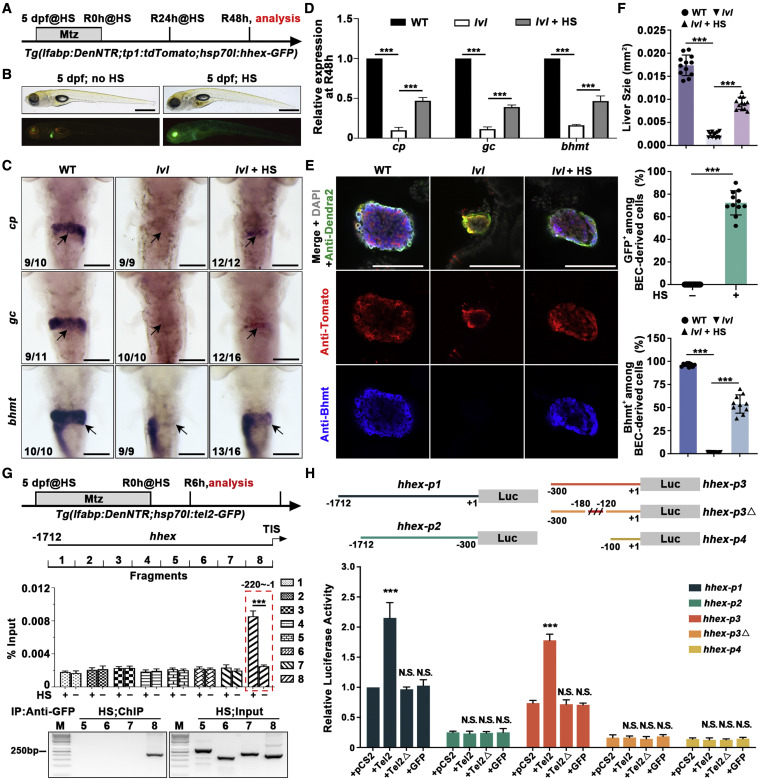
Fig. 6 Figure 6. Redifferentiation of BP-PCs regulated by Tel2 is partially mediated via Hhex (A) Experimental schematic illustrating the stages of Mtz and HS treatment and analysis at R48h. (B) BF and epifluorescence images showing normal body phenotypes, and the whole-mount overexpression of Hhex-GFP was induced upon HS. (C) WISH images showing expression of cp, gc, and bhmt at R48h. Arrows point to the liver region. (D) Quantitative real-time PCR data showing relative expression levels of cp, gc, and bhmt in WT, lvl, and hhex-overexpressed lvl regenerating livers at R48h. n = 3 technical replicates. Values represent means ± SD. ∗∗∗p < 0.001 by t test. (E) Single optical section images showing Dendra2-NTR (green), Tomato (red), Bhmt (blue), and DAPI (gray) expression in regenerating livers at R48h. Bhmt expression in BEC-derived cells of lvl was rescued by Hhex-GFP overexpression. (F) Graph showing quantification of liver size and percentage of GFP+ or Bhmt+ among BEC-derived cells shown in (E); n = 10–12 larvae. Values represent means ± SD. ∗∗∗p < 0.001 by t test. (G) Top panel: experimental schematic illustrating the stages of HS treatment and analysis at R6h. Tg(hsp70l:tel2-GFP) was used to generate Tel2-GFP by HS. Binding of Tel2 to the putative hhex promoter was measured by ChIP assays with or without HS using a GFP antibody. Eight pairs of specific primers for hhex promoter regions (−1 to −1712 bp) were designed to amplify 8 DNA fragments covering the promoter sequences of hhex-1.7 kb. Center panel: quantitative real-time PCR showing DNA fragments enrichment following ChIP. Bottom panel: agarose gel electrophoresis of ChIP-PCR showing the interaction between Tel2-GFP and DNA fragments. n = 3 technical replicates. Values represent means ± SD. ∗∗∗p < 0.001 by t test. (H) Top panel: the hhex promoter, hhex-p1 (−1 to −1712 bp), hhex-p2 (−300 to −1712 bp), hhex-p3 (−1 to −300 bp), hhex-p3Δ (deleted −120 to −180 bp), and hhex-p4 (−1 to −100 bp) were cloned to the pGL3 vector. Bottom panel: luciferase activity assays showing that Tel2, but not lvl mutated protein (Tel2Δ) or GFP, activated the transcriptional activity of hhex-p1 but not hhex-p2 and that the sequences between −120 and −180 in hhex-p3 harbored the Tel2-responsive elements. n = 3 technical replicates. Values represent means ± SD. ∗∗∗p < 0.001 by t test. Numbers indicate the proportion of larvae exhibiting the phenotype shown. Scale bars, 100 μm (C and E) and 400 μm (B). TIS, translation initiation site. See also Figure S6.