
- Title
-
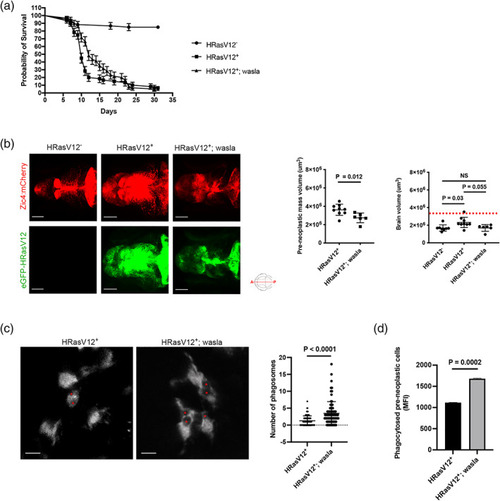
Wasl is crucial to maintain microglial core activities during glioblastoma initiation stages
- Authors
- Mazzolini, J., Le Clerc, S., Morisse, G., Coulonges, C., Zagury, J.F., Sieger, D.
- Source
- Full text @ Glia
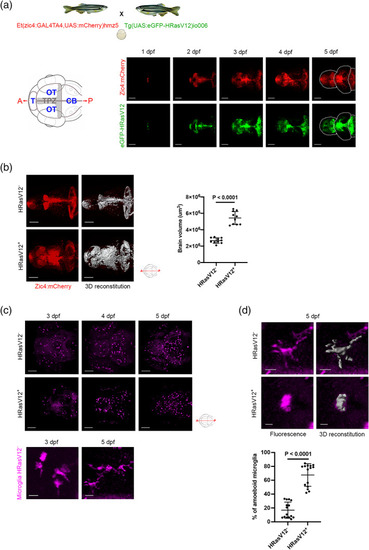
HRasV12 expression in the proliferating regions of the developing CNS alters microglia morphology. (a) Schematic representation of the zebrafish germline system used to induce HRasV12 expression based on the outcross of the indicated fish lines. Schematic anterior‐posterior dorsal view of the brain representing the main sub‐divisions: telencephalon (T), optic tectum (OT) cerebellum (CB) and tectal proliferation zone (TPZ) in gray. Confocal images showing mCherry and eGFP‐HRasV12 fluorescent signal in the proliferating regions of the developing brain of HRasV12+ larvae from 1 to 5 dpf. White dotted lines mark the main brain subdivisions. Scale bar represents 100 μm. (b) Brain volume was assessed using Imaris surface tool to build the segmented images (right panels) of the mCherry signal (left panels) of proliferating regions of the developing brain from 5 dpf HRasV12− (top panels) and HRasV12+ (bottom panels). Scale bar represents 100 μm. Brain volumes of 5 dpf HRasV12− and HRasV12+ larvae were quantified. HRasV12−: |
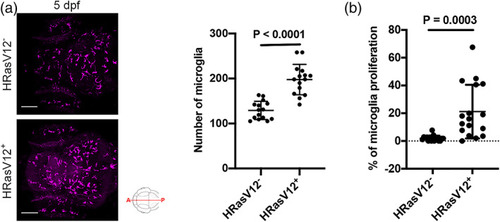
Pre‐neoplastic cells promote microglia proliferation. (a) Confocal images of the microglial population (magenta) of 5 dpf HRasV12− (top panel) and HRasV12+ (lower panel) larvae. Scale bar represents 100 μm. Quantifications revealed a higher number of microglia in HRasV12+ brains compared to HRasV12− brains at 5 dpf. HRasV12−: |
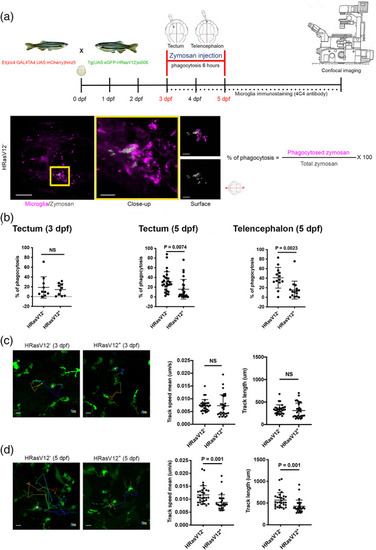
HRasV12+ cells affect actin cytoskeleton dependent microglial functions. (a) Schematic representation of the phagocytosis assay used to measure microglia phagocytic activity of 3 and 5 dpf HRasV12− and HRasV12+ larvae. Zymosan coupled with a fluorochrome was injected into either the telencephalon or the tectum of HRasV12− and HRasV12+ larvae at 3 and 5 dpf. Larvae were incubated for 6 h post‐injection at 28.5°C, fixed, then labeled with the 4C4 antibody to visualize microglia. Confocal image of a 5 dpf control larval brain injected with zymosan (white) into tectum (yellow square). Scale bar represents 100 μm. Close‐up of the injection site reveals zymosan phagocytosed by microglia (magenta). Scale bar represents 20 μm. The Imaris surface tool was used to segment and read out the sum of fluorescence from zymosan internalized by microglia (magenta surface) as well as the total amount of injected zymosan within the telencephalon or tectum (gray surface). The percentage of phagocytosis was calculated following the indicated formula. (b) Efficiency of phagocytosis was calculated for 3 and 5 dpf HRasV12− and HRasV12+ larvae injected with zymosan into either the telencephalon or the tectum. Results are expressed as a percentage of the total amount of injected zymosan. 3 dpf: HRasV12−: PHENOTYPE:
|
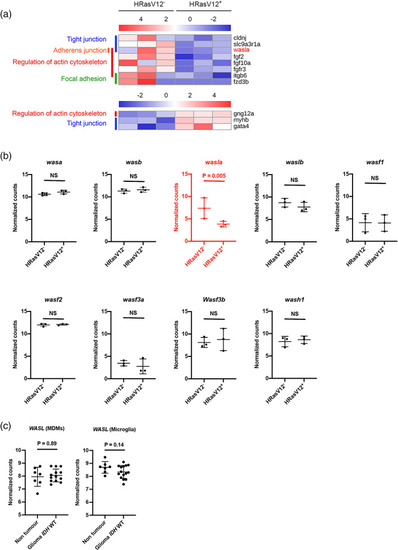
The actin nucleation promoting factor |

|
Microglial PHENOTYPE:
|