|
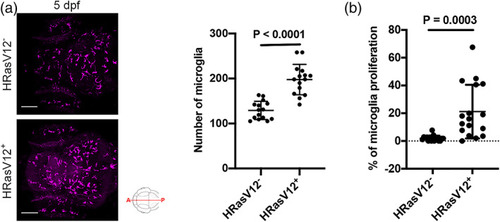
Pre‐neoplastic cells promote microglia proliferation. (a) Confocal images of the microglial population (magenta) of 5 dpf HRasV12− (top panel) and HRasV12+ (lower panel) larvae. Scale bar represents 100 μm. Quantifications revealed a higher number of microglia in HRasV12+ brains compared to HRasV12− brains at 5 dpf. HRasV12−: n = 15; HRasV12+: n = 15; N = 3. Error bars represent mean ± SD. (b) To measure microglia proliferation, the number of 4C4+/EdU+ cells was measured within the microglial population of 5 dpf control and HRasV12+ larvae. Results are expressed as a percentage of total microglia. HRasV12−: n = 17; HRasV12+: n = 17; N = 3. Error bars represent mean ± SD. Error bars represent mean ± SD. Images were captured using a Zeiss LSM710 confocal microscope with a 20X/NA 0.8 objective. All images represent the maximum intensity projections of Z stacks
|