IMAGE

FIGURE 2

ID
ZDB-IMAGE-220730-35
Antibodies
Source
Figures for Mazzolini et al., 2022
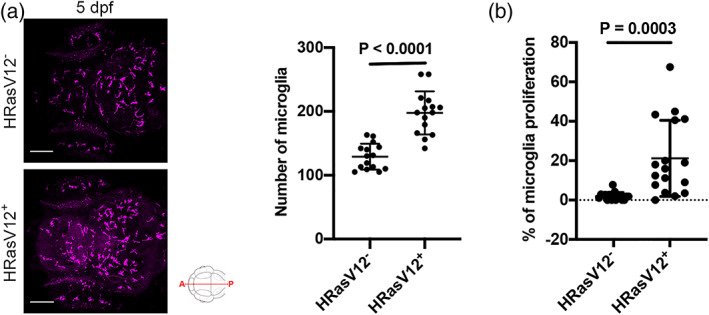
Image
Figure Caption

FIGURE 2

Pre‐neoplastic cells promote microglia proliferation. (a) Confocal images of the microglial population (magenta) of 5 dpf HRasV12 (top panel) and HRasV12+ (lower panel) larvae. Scale bar represents 100 μm. Quantifications revealed a higher number of microglia in HRasV12+ brains compared to HRasV12 brains at 5 dpf. HRasV12: n = 15; HRasV12+: n = 15; N = 3. Error bars represent mean ± SD. (b) To measure microglia proliferation, the number of 4C4+/EdU+ cells was measured within the microglial population of 5 dpf control and HRasV12+ larvae. Results are expressed as a percentage of total microglia. HRasV12: n = 17; HRasV12+: n = 17; N = 3. Error bars represent mean ± SD. Error bars represent mean ± SD. Images were captured using a Zeiss LSM710 confocal microscope with a 20X/NA 0.8 objective. All images represent the maximum intensity projections of Z stacks

Figure Data
Acknowledgments
This image is the copyrighted work of the attributed author or publisher, and ZFIN has permission only to display this image to its users. Additional permissions should be obtained from the applicable author or publisher of the image. Full text @ Glia