
- Title
-
New Findings on LMO7 Transcripts, Proteins and Regulatory Regions in Human and Vertebrate Model Organisms and the Intracellular Distribution in Skeletal Muscle Cells
- Authors
- Gomes, G., do Amaral, M.J., Bagri, K.M., Vasconcellos, L.M., Almeida, M.D.S., Alvares, L.E., Mermelstein, C.
- Source
- Full text @ Int. J. Mol. Sci.
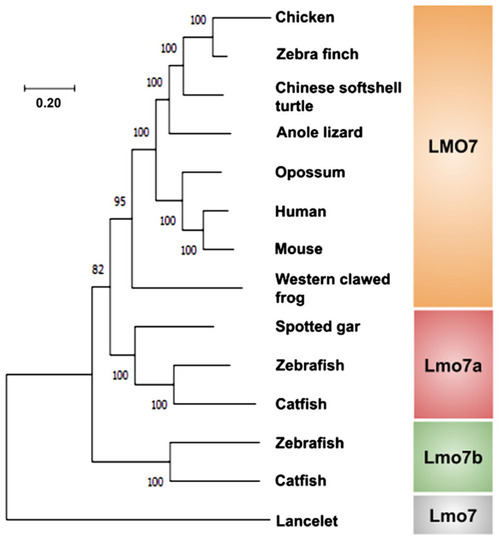
Molecular phylogenetic tree of the LMO7 proteins from representative species of vertebrates. The phylogenetic tree was inferred from amino acid sequences using the Branchiostoma floridae Lmo7 protein as an out-group. Bootstrap values were obtained by the neighbor-joining method (1000 replications) using the MEGA 11 software. |

Comparison of the exon–intron organization of the LMO7 transcripts predicted for human and vertebrate model organisms (mouse, chicken, Xenopus and zebrafish). Location of the calponin (CH), PDZ and LIM zinc-binding (LIM) domains is shown for all the species. The CH domain is missing in the chicken LMO7 transcript. The longest transcripts predicted for the two zebrafish lmo7 ortholog genes (lmo7a and lmo7b) are depicted. |
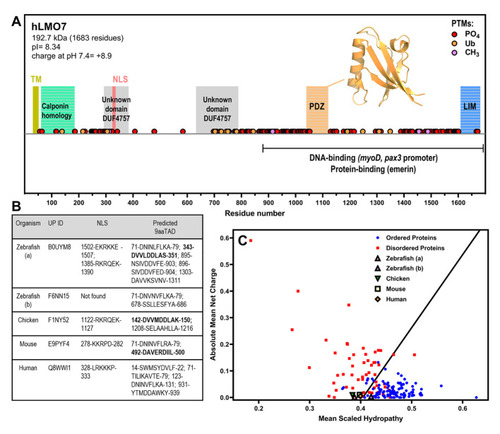
LMO7 is a multidomain protein that has a charge–hydropathy characteristic of proteins enriched in intrinsic disorder and contains nuclear localization sequence(s) and putative nine-amino-acid transactivation motifs. (A) Schematic organization of human LMO7 with the domains, motifs and post-translational modifications (PTMs) indicated along sequence. The C-terminal domain mediates interaction with DNA promoters and protein partners. TM, transmembrane α-helix. NLS, nuclear localization sequence. PO4, phosphorylation. Ub, ubiquitination. CH3, methylation. The inset shows the X-ray crystallographic structure of the PDZ domain (PDB 2eaq). (B) LMO7 from different species were analyzed by NLSdb (third column, https://rostlab.org/services/nlsdb/, 20 November 2021) and 9aaTAD (fourth column, https://www.med.muni.cz/9aaTAD/). Perfect matches of 9aaTAD are highlighted in bold whereas other annotated motifs correspond to 92% matches. Corresponding UniProt identifiers (UP ID) are shown in the second column. (C) Predictor of Natural Disordered Regions (PONDR; http://www.pondr.com/) analysis of charge–hydropathy (CH plot). Well-folded proteins indicated as blue circles and disordered proteins as red squares. LMO7 from the different species is located in the plot region of disordered proteins apart from isoform b of zebrafish. |
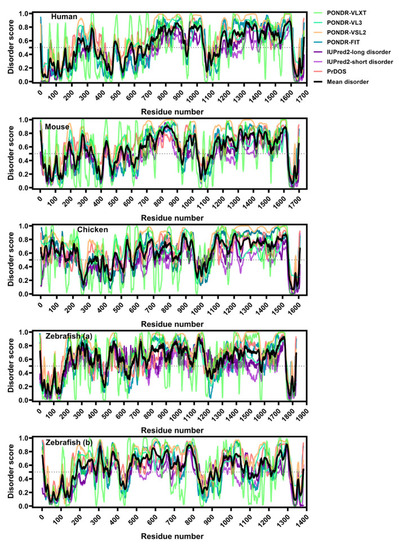
LMO7 is enriched in intrinsic disorder and this feature is conserved across evolution. Analysis of intrinsic disorder by seven disorder predictors along the LMO7 primary structure. Note that the C-terminal protein/DNA-binding region is the longest disordered segment. Data from PONDR-VLXT (light green curve), PONDR-VL3 (green curve) and PONDR-VSL2 (pale orange curve) were provided by http://www.pondr.com/; from PONDR-FIT (blue curve)—by http://original.disprot.org/pondr-fit.php; from IUPred2-long disorder (dark purple curve) and IUPred2-short disorder (purple curve)—by https://iupred2a.elte.hu/plotand; from PrDOS (pink curve)—by http://prdos.hgc.jp/cgi-bin/top.cgi. The average of disorder across all the algorithms was calculated (black curve). Scores higher than 0.5 represent disordered regions, and values between 0.2 and 0.5 indicate flexible segments. |
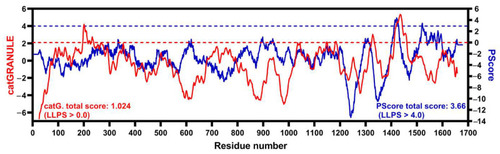
A C-terminal short segment of hLMO7 is predicted to undergo liquid–liquid phase separation. Propensity for hLMO7 LLPS ability along the primary structure calculated by catGRANULE (red curve, http://service.tartaglialab.com/new_submission/catGRANULE) and PScore (blue curve, http://abragam.med.utoronto.ca/~JFKlab/Software/psp.htm). |
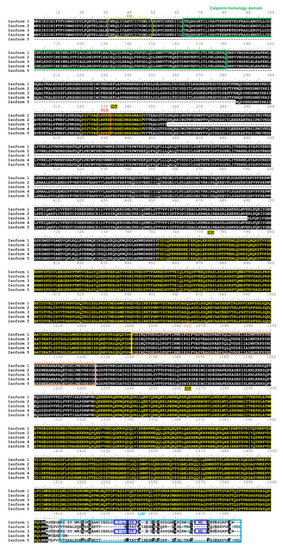
hLMO7 transcript variants show conserved intrinsic disorder but differ in the LIM domain. Alignment of hLMO7 isoforms 1 to 5 (UniProt IDs Q8WWI1-1; Q8WWI1-2; Q8WWI1-3; Q8WWI1-4; Q8WWI1-5, respectively) obtained by Clustal Omega [41]. The predicted domains, motifs and intrinsically disordered regions (IDR) reported in the Database of Disordered Protein Predictions (D2P2) [31] are marked by rectangles and the sequences indicated above. Isoform 5 lacks the putative transmembrane α-helix (TM, predicted by Phobius at https://phobius.sbc.su.se/) and the calponin homology domain (CH). Isoform 3 lacks residues 356–690. The LIM domain is missing in isoform 4. Isoforms 2 and 5 do not have the key zinc ion coordination motifs (dark blue rectangles). Cysteine and histidine residues that might also be involved in Zn(II) binding are marked in purple and blue, respectively. NLS, nuclear localization signal predicted by NLSdb (https://rostlab.org/services/nlsdb/). |
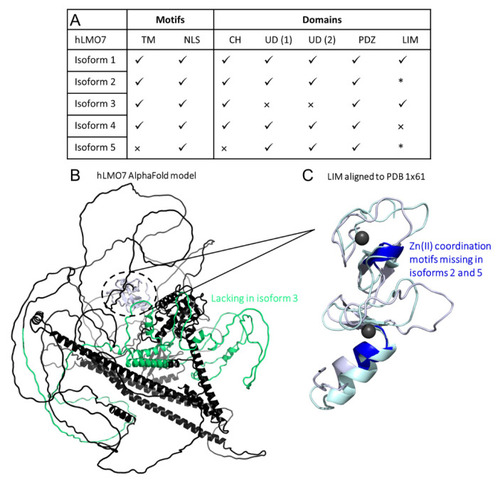
Comparison of domains organization of the five isoforms from human LMO7. (A) Summary of results from the primary structure alignment among the hLMO7 isoforms. √, presence. ×, absence. * lacks Zn(II) binding motifs. TM, transmembrane α-helix. NLS, nuclear localization sequence. CH, calponin homology domain. UD, unknown domain DUF4757. (B) hLMO7 Alpha Fold-predicted structural model showing the region missing in isoform 3 (green) and the LIM domain (white) which is only conserved in isoforms 1 and 3. (C) Superimposition of the LIM domain of hLMO7 (obtained by AlphaFold; white ribbon representation) and the LIM domain of TRIP6 (PDB 1X61; pale green ribbon representation), which is the closest structural analog reported by I-TASSER [42]. Two zinc ions (black spheres) are coordinated in the fingers. Regions highlighted in dark blue are missing in isoforms 2 and 5. Furthermore, isoform 4 does not have the full LIM domain. |
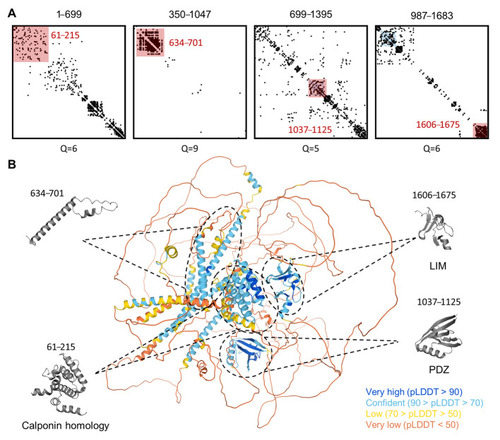
Three-dimensional structure model prediction of hLMO7 indicates the presence of well-folded domains and many intrinsic disorder regions with long-range evolutionary couplings. The evolutionary couplings of overlapping regions of LMO7 were calculated by the EVcoupling server (A). The quality scores (Q) for the identification of evolutionary couplings are indicated for each segment and range from 0 (worst) to 10 (best). The pink-shaded squares highlight well-folded domains previously described (residues 61–215, 1037–1125 and 1606–1675) as well as the one identified here (residues 634–701). The 3D structure calculated by the AlphaFold server is indicated in (B). Each globular domain highlighted by EVcoupling is indicated in the 3D model. The full-length protein 3D model is colored by the fold prediction confidence score for each amino acid residue (bottom right legend). |
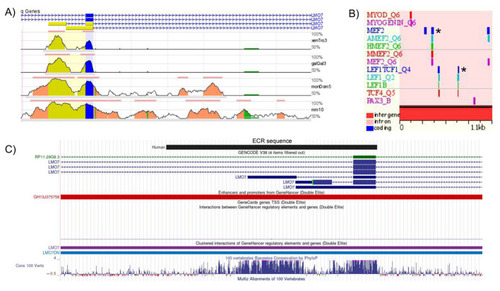
Evolutionarily conserved region (ECR) in the LMO7 loci of human and other vertebrate species with features of a skeletal muscle-specific regulatory element. (A) Conservation profiles of the human LMO7 genomic region (base sequence, on top) in comparison with the mouse (mm10), opossum (momDom5), chicken (Galgal3) and Xenopus (XenTro3) ortholog regions. The 5′–3′ orientation of the human transcripts is denoted by arrow lines. The color codes used to indicate different gene regions are: exons (blue), 5′ UTRs (yellow), introns (pink), repetitive elements (green). Each line represents an alignment, and the vertical height indicates the sequence identity underlying the alignment. (B) The human ECR displays several potential binding sites for key regulators of skeletal myogenesis, such as PAX3, MYOD, MYOGENIN and MEF2. Two sets of the LEF1/TCF4 binding sites are predicted in the human ECR. The asterisk indicates the MEF2 and LEF1/TCF4 binding sites that are conserved in mouse, opossum, chicken and Xenopus. (C) UCSC genome browser display of the BLAT alignment of the human ECR to the human GRCh38/hg38 assembly. The human ECR sequence overlaps with the GH13J075758 promoter/enhancer of the GeneHancer catalog. |
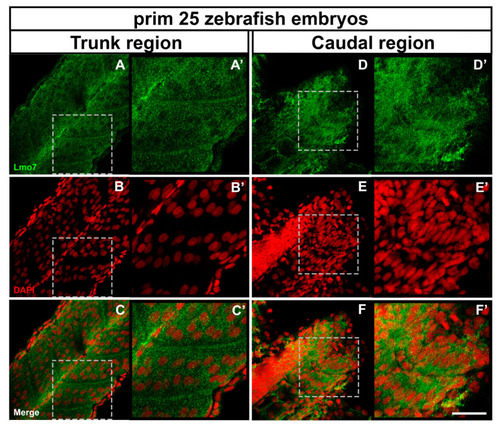
LMO7 distribution in zebrafish embryos. Prim 25 zebrafish embryos were double-labeled with an antibody against LMO7 (green) and the nuclear dye DAPI (red) and analyzed under a confocal laser microscope. The images shown in (A’–F’) are higher magnifications of the dashed areas marked in the corresponding panels (A–F). In somites of the trunk region of prim 25 zebrafish embryos, Lmo7 was found near the septa, the notochord and in the cytoplasm of skeletal muscle progenitor cells (A–C and A’–C’), while in the caudal region, it was found in the cytoplasm and the perinuclear region of muscle cells (D–F and D’–F’). Scale bar = 50 µm. EXPRESSION / LABELING:
|
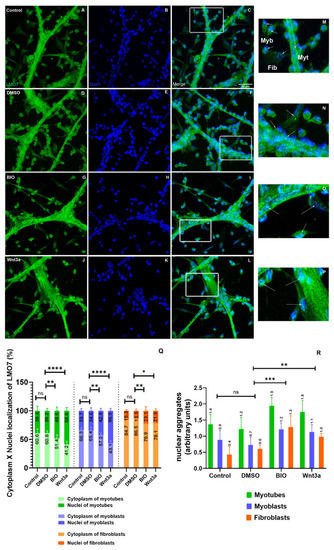
LMO7 intracellular distribution in chicken muscle cells. Chicken myogenic cells were grown for 24 h and treated with DMSO, BIO or Wnt3a for the next 24 h. The cells were double-labeled with an antibody against LMO7 (green) and the nuclear dye DAPI (blue) and analyzed under a confocal laser microscope. Insets (M–P) are higher magnifications of the areas marked in the images C,F,I and L. In the control and DMSO-treated cells, LMO7 is found in the perinuclear region of myotubes and within the nuclei of myoblasts (A–F and M,N). Both BIO and Wnt3a induced an increase in the nuclear labeling of LMO7 (G–L and O,P). Arrows in the insets point to LMO7 localization in myoblasts (Myb), myotubes (Myt) and fibroblasts (Fib). Scale bar for A–L = 20 µm. Quantification of the intracellular localization of LMO7 in the cytoplasm versus the nuclei of cells (Q) and of the fluorescence intensity of LMO7-positive nuclear aggregates (R) is shown. ns = not significant, * = 0.01, ** = 0.07, *** = 0.004, **** = 0.0001. |
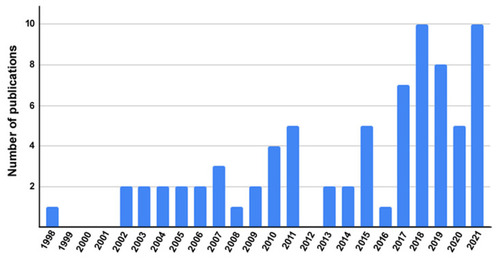
Frequency of LMO7-containing articles published per year. Data retrieved from the PubMed (https://pubmed.ncbi.nlm.nih.gov/) database using descriptors “LMO7” OR “Lmo7” OR “LMO-7” OR “Lmo-7” OR “Lim domain only protein 7”. The search returned 76 articles as of 10 October 2021 for a period that spanned the years 1998 to 2021. From the total of 76 articles, we analyzed the number of LMO7 articles published per year. |
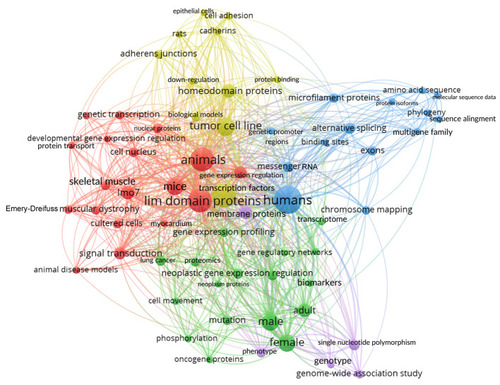
Bibliometric analysis of the co-occurrence relations between scientific terms found in the LMO7 articles. A term map of co-occurrence relations between the scientific terms was created from the bibliometric data retrieved from the titles and abstracts of the published LMO7 articles. The query was performed on October 10, 2021, by using descriptors [lmo7] OR [LMO7] OR [LMO-7] OR [lmo-7] OR [lim domain only protein 7] OR [Lim Domain Only Protein 7]. Five different colors indicate clusters of related terms. |