
Figure 11
- ID
- ZDB-FIG-211216-52
- Publication
- Gomes et al., 2021 - New Findings on LMO7 Transcripts, Proteins and Regulatory Regions in Human and Vertebrate Model Organisms and the Intracellular Distribution in Skeletal Muscle Cells
- Other Figures
- All Figure Page
- Back to All Figure Page
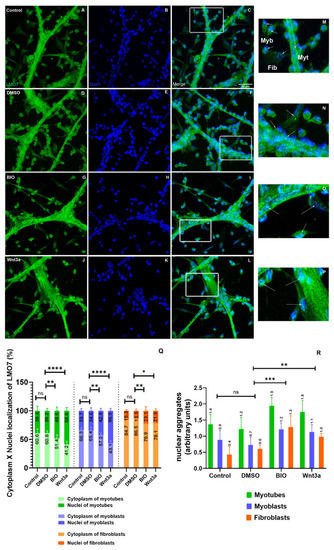
LMO7 intracellular distribution in chicken muscle cells. Chicken myogenic cells were grown for 24 h and treated with DMSO, BIO or Wnt3a for the next 24 h. The cells were double-labeled with an antibody against LMO7 (green) and the nuclear dye DAPI (blue) and analyzed under a confocal laser microscope. Insets (M–P) are higher magnifications of the areas marked in the images C,F,I and L. In the control and DMSO-treated cells, LMO7 is found in the perinuclear region of myotubes and within the nuclei of myoblasts (A–F and M,N). Both BIO and Wnt3a induced an increase in the nuclear labeling of LMO7 (G–L and O,P). Arrows in the insets point to LMO7 localization in myoblasts (Myb), myotubes (Myt) and fibroblasts (Fib). Scale bar for A–L = 20 µm. Quantification of the intracellular localization of LMO7 in the cytoplasm versus the nuclei of cells (Q) and of the fluorescence intensity of LMO7-positive nuclear aggregates (R) is shown. ns = not significant, * = 0.01, ** = 0.07, *** = 0.004, **** = 0.0001. |