
Figure 8
- ID
- ZDB-IMAGE-211216-51
- Publication
- Gomes et al., 2021 - New Findings on LMO7 Transcripts, Proteins and Regulatory Regions in Human and Vertebrate Model Organisms and the Intracellular Distribution in Skeletal Muscle Cells
- All Figures
- Figures for Gomes et al., 2021
|
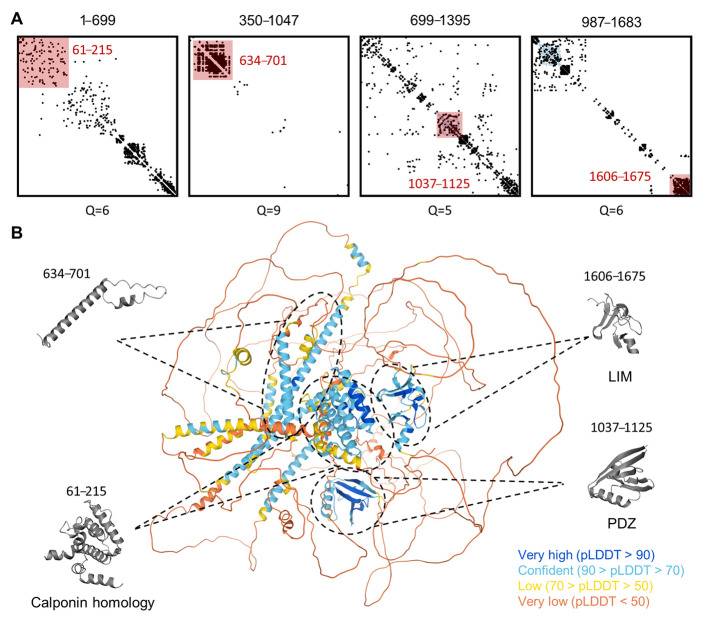
Figure 8 Three-dimensional structure model prediction of hLMO7 indicates the presence of well-folded domains and many intrinsic disorder regions with long-range evolutionary couplings. The evolutionary couplings of overlapping regions of LMO7 were calculated by the EVcoupling server (A). The quality scores (Q) for the identification of evolutionary couplings are indicated for each segment and range from 0 (worst) to 10 (best). The pink-shaded squares highlight well-folded domains previously described (residues 61–215, 1037–1125 and 1606–1675) as well as the one identified here (residues 634–701). The 3D structure calculated by the AlphaFold server is indicated in (B). Each globular domain highlighted by EVcoupling is indicated in the 3D model. The full-length protein 3D model is colored by the fold prediction confidence score for each amino acid residue (bottom right legend).