
IMAGE
Figure 5
- ID
- ZDB-IMAGE-211216-35
- Publication
- Gomes et al., 2021 - New Findings on LMO7 Transcripts, Proteins and Regulatory Regions in Human and Vertebrate Model Organisms and the Intracellular Distribution in Skeletal Muscle Cells
- All Figures
- Figures for Gomes et al., 2021
Image
|
Figure Caption
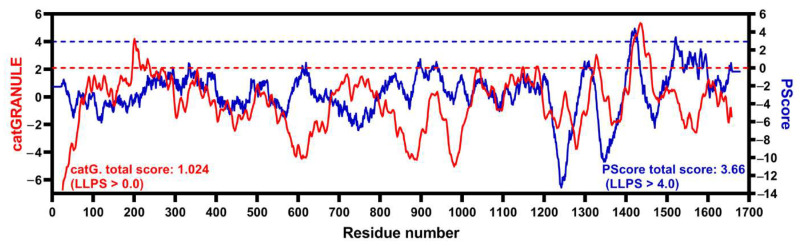
Figure 5 A C-terminal short segment of hLMO7 is predicted to undergo liquid–liquid phase separation. Propensity for hLMO7 LLPS ability along the primary structure calculated by catGRANULE (red curve, http://service.tartaglialab.com/new_submission/catGRANULE) and PScore (blue curve, http://abragam.med.utoronto.ca/~JFKlab/Software/psp.htm).
Acknowledgments
This image is the copyrighted work of the attributed author or publisher, and
ZFIN has permission only to display this image to its users.
Additional permissions should be obtained from the applicable author or publisher of the image.
Full text @ Int. J. Mol. Sci.