
Figure 4
- ID
- ZDB-FIG-211216-45
- Publication
- Gomes et al., 2021 - New Findings on LMO7 Transcripts, Proteins and Regulatory Regions in Human and Vertebrate Model Organisms and the Intracellular Distribution in Skeletal Muscle Cells
- Other Figures
- All Figure Page
- Back to All Figure Page
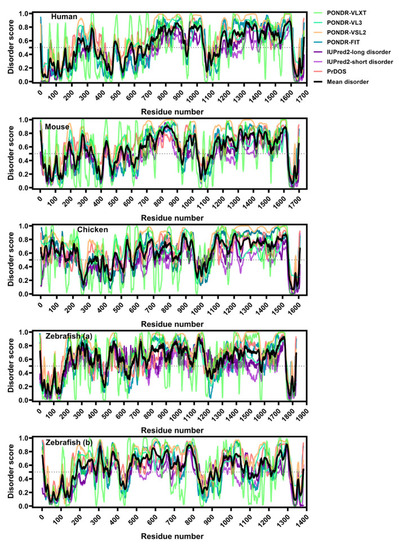
LMO7 is enriched in intrinsic disorder and this feature is conserved across evolution. Analysis of intrinsic disorder by seven disorder predictors along the LMO7 primary structure. Note that the C-terminal protein/DNA-binding region is the longest disordered segment. Data from PONDR-VLXT (light green curve), PONDR-VL3 (green curve) and PONDR-VSL2 (pale orange curve) were provided by http://www.pondr.com/; from PONDR-FIT (blue curve)—by http://original.disprot.org/pondr-fit.php; from IUPred2-long disorder (dark purple curve) and IUPred2-short disorder (purple curve)—by https://iupred2a.elte.hu/plotand; from PrDOS (pink curve)—by http://prdos.hgc.jp/cgi-bin/top.cgi. The average of disorder across all the algorithms was calculated (black curve). Scores higher than 0.5 represent disordered regions, and values between 0.2 and 0.5 indicate flexible segments. |