
- Title
-
An ATX-LPA6-Gα13-ROCK axis shapes and maintains caudal vein plexus in zebrafish
- Authors
- Okasato, R., Kano, K., Kise, R., Inoue, A., Fukuhara, S., Aoki, J.
- Source
- Full text @ iScience
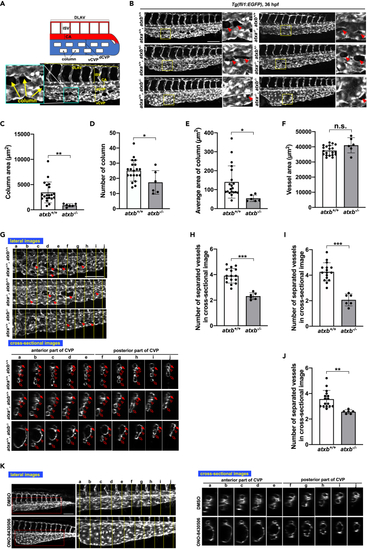
Abnormal caudal vein plexus (CVP) structure in atxb mutant embryos (A) Schematic diagram of blood vessels in the caudal region of the zebrafish embryo. DLAV, dorsal longitudinal anastomotic vessel; ISV, intersegmental vessel; CA, caudal aorta; dCVP, dorsal part of CVP; vCVP, ventral part of CVP. (B) Projection view of confocal z stack images of CVP from the lateral side of wild-type (atxa+/+/atxb+/+), atxb heterozygous (atxa+/+/atxb+/−) and homozygous (atxa+/+/atxb−/−), atxa homozygous (atxa−/−/atxb+/+), atxa homozygous atxb heterozygous (atxa−/−/atxb+/−) and atxa/atxb double-homozygous (atxa−/−/atxb−/−) mutant embryos at 36 hpf. Enlarged images of the area surrounded by squares are positioned on the right side. Arrowheads show the column structure formed between vessels. Scale bar, 100 μm. (C–F) Quantitative evaluation of CVP’s morphology from confocal images from the lateral side. Ten somites from the end of the yolk extension were evaluated. Data were shown as mean with SD of sixteen atxb+/+ and six atxb−/− embryos. p value was calculated by the student’s t test (∗p < 0.05; ∗∗p < 0.01; n.s., no significance). (C) The total area of columns in the ten somites was quantified by Zen 2 (blue edition) software and shown. (D) The total number of columns present across the ten somites. (E) The average area of columns (Total area of columns (C) divided by the number of columns (D)). (F) Total vessel area. The EGFP-positive area was quantified as a vessel area. (G) The cross-sectional single-plane images of CA, dCVP and vCVP from wild-type (atxb+/+/atxb+/+), ATXa KO (atxa−/−/atxb+/+) and ATXb KO (atxb+/+/atxb−/−) embryos at the positions indicated by yellow lines in the upper lateral view are shown in the lower side. Ten somites from the end of the yolk extension were analyzed. Somites a to e and somites f to j were defined as anterior and posterior somites, respectively. Arrowheads indicate the column structures in the lateral images. Arrows, hollow arrowheads and hollow arrows in the cross-sectional images indicate the CA, dCVP and vCVP, respectively. Note that in atxb−/− embryos CA and dCVP were not separated in the posterior part. Scale bar, 100 μm. (H–J) Quantitative evaluation of CVP’s morphology from the cross-sectional images. Data were shown as mean with SD of sixteen atxb+/+ and six atxb−/− embryos. p value was calculated by the student’s t test (∗∗p < 0.01; ∗∗∗p < 0.001). The graphs show the average number of separated vessels in the cross-sectional images from ten somites (somites a to j, H), five anterior somites (somites a to e, I), and five posterior somites (somites f to j, J). (K) Projection views of confocal z stack images from lateral side and cross-sectional images of CVP at 36 hpf. Wild-type embryos were treated with ATX inhibitor, ONO-8430506, from 25 to 36 hpf. Schematic diagrams of the protocol are also shown in the upper side. Scale bar, 100 μm. See also Figures S1, S5, and S6, Videos S1 and S2. |
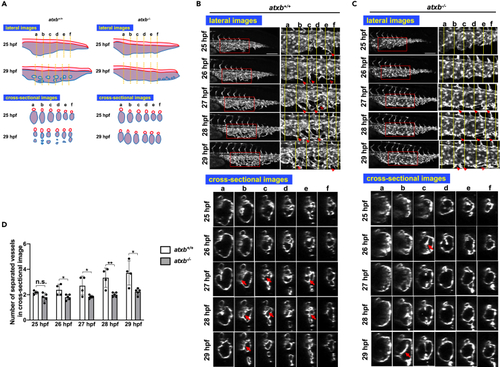
Abnormal vessel segmentation in ATXb KO embryos (A) Schematic diagrams explaining the phenotype of ATXb KO embryos. DA and CVP are drawn in red and blue, respectively. The diagrams for cross-sectional images at the yellow dot line (lower panel) are shown, indicating that ATXb KO embryos have large and sac-like CVP. (B and C) Sequential time-lapse images of wild-type (atxb+/+) (B) and atxb−/− (C) embryos at the indicated time points. Both projection views from the lateral side (upper panel) and cross-sectional images (lower panel) are shown. Enlarged images of the area surrounded by squares in lateral images are positioned in the right side (upper panel). In atxb+/+ embryos, endothelial cells (ECs) sprout ventrally from the CV (dCVP primordia) and anastomose each other (upper panel). Arrowheads and hollow arrowheads indicate sprouting and anastomosing (rejoining) EC cells, respectively. The sectional images at the six somites (a to f) (lower panel) show that the subdivision of dCVP proceeds in time dependent manner. In this process, ECs sprout into the CV lumen and form a cross-linked (bridging) structure (shown by arrows). Then, CV constriction and subdivision proceed in parallel. In an atxb−/− embryo (C), we observed extremely little vessel subdivision, which results in remaining of large lumens. Note that both EC sprouting and the sign of forming the bridging structure are still observed, even less frequently. Scale bars, 100 μm. (D) Numbers of separated vessels surrounded by endothelial cells in a cross section (somite a–f in Figures 2B and 2C) at the indicated timepoints. Four wild-type (atxb+/+) and five ATXb homozygous (atxb−/−) embryos were evaluated. All data were expressed as means and SD. p value was calculated by the student’s t test (∗p < 0.05; ∗∗p < 0.01; n.s., no significance). See also Video S3. Time-lapse fluorescent microscopic image of wild-type Tg(fli1:EGFP) embryo in a lateral view, related to Figure 2, Video S4. Time-lapse fluorescent microscopic image of wild-type Tg(fli1:EGFP) embryo in a cross-sectional view, related to Figure 2, Video S5. Time-lapse fluorescent microscopic image of ATXb KO (atxb−/−) Tg(fli1:EGFP) embryo in a lateral view, related to Figure 2. |
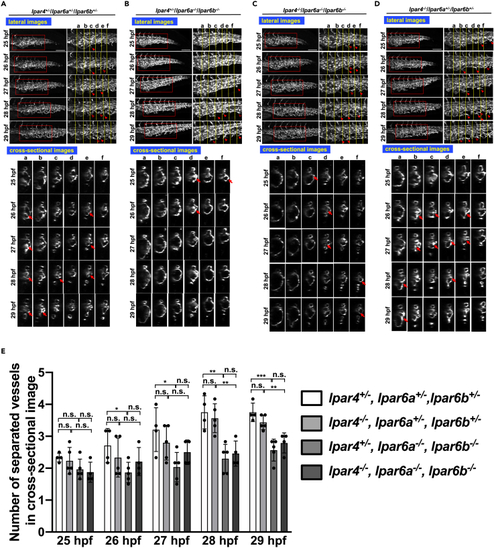
Similar abnormal CVP structure in lpar6a/lpar6b double mutant embryos (A–D) Sequential time-lapse images of control (lpar4+/−/lpar6a+/−/lpar6b+/−) (A) and lpar4+/−/lpar6a−/−/lpar6b−/− (B), lpar4−/−/lpar6a−/−/lpar6b−/− (C), and lpar4−/−/lpar6a+/−/lpar6b+/− (D) embryos at the indicated time points. Both projection views from the lateral side (upper panel) and sectional images (lower panel) are shown. Enlarged images of the area surrounded by squares are positioned in the right side (upper panel). In all embryos, endothelial cell (EC) sprouts and their anastomosis were observed although less frequent in lpar4+/−/lpar6a−/−/lpar6b−/− (B) and lpar4−/−/lpar6a−/−/lpar6b−/− (C) embryos. Arrowheads and hollow arrowheads indicate sprouts and anastomosed (re-joined) sprouts, respectively. Cross-linked structure formed in lumen is pointed with arrows. Vessel subdivision was significantly attenuated in lpar4+/−/lpar6a−/−/lpar6b−/− (B) and lpar4−/−/lpar6a−/−/lpar6b−/− embryos (C), which resulted in the remaining large lumens, as was observed for atxb−/− mutants. Note that both EC sprouting and the sign of forming the bridging structure are still observed, even less frequently. Scale bars, 100 μm. (E) Numbers of separated vessels surrounded by endothelial cells in a cross section (somite a-f in Figures 3A–3D) at the indicated timepoints. Four or five embryos with genotypes shown were evaluated (lpar4+/−lpar6a+/−lpar6b+/− n = 4, lpar4−/−lpar6a+/−lpar6b+/− n = 5, lpar4+/−lpar6a−/−lpar6b−/− n = 5, lpar4−/−lpar6a−/−lpar6b−/− n = 4). All data were expressed as means and SD. p value was calculated by the student’s t test (∗p < 0.05; ∗∗p < 0.01; ∗∗∗p < 0.001; n.s., no significance). See also Figure S7. |
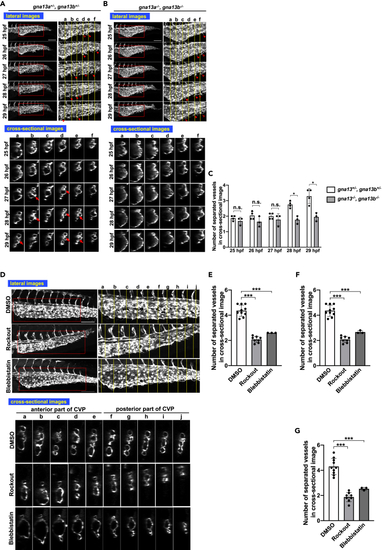
Similar abnormal CVP structure in gna13a/gna13b double mutant embryos and embryos treated with inhibitors of actin stress fiber formation (A, B, and D) All images are projection views of confocal z stack images and cross-sectional images of CVP. Scale bars, 100 μm. For (D), inhibitors were added at 24 hpf and images were taken at 36 hpf. (A and B) Images of control (gna13a+/−/gna13b+/−) and gna13a/gna13b double KO (gna13a−/−/gna13b−/−) embryos were taken from 25 hpf to 29 hpf. Arrowheads and hollow arrowheads indicate sprouts and anastomosed (re-joined) sprouts, respectively. Cross-linked structure formed in lumen is pointed with arrows. (C) Numbers of separated vessels surrounded by endothelial cells in a cross section (somite a–f in A and B) at the indicated timepoints. Four gna13a+/−/gna13b+/− and three gna13a−/−/gna13b−/− embryos were evaluated. All data were expressed as means and SD. p value was calculated by the student’s t test (∗p < 0.05; ∗∗p < 0.01; n.s., no significance). (D) Embryo treated with DMSO only (negative control), ROCK inhibitor (Rockout), or inhibitor of stress fiber formation (Blebbistatin). Note that the vessel subdivision is rarely observed in the anterior somites in gna13a−/−/gna13b−/− embryos and in embryos treated with Rockout and Blebbistatin. (E–G) Numbers of separated vessels surrounded by endothelial cells in a cross section (somite a–f in D) from three to ten embryos (DMSO n = 10, Rockout n = 3, Blebbistatin n = 8). The anterior somites a–e (E), the posterior somites f–j (F) and all somites (a–j) (G) were evaluated. All data were expressed as means and SD. p value was calculated by the student’s t test (∗∗∗p < 0.001). See also Figure S8. |
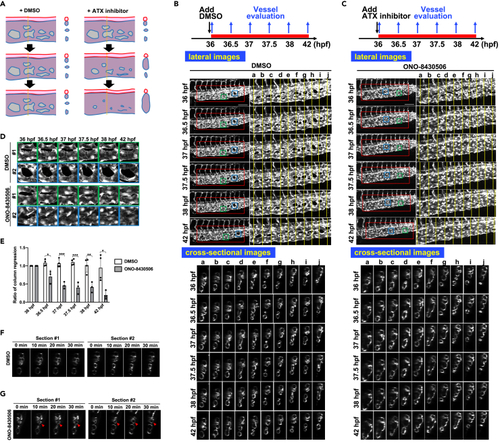
ATX has a role in maintaining CVP structure (A) Schematic diagram explaining the effect of ATX inhibition on CVP structure. DA and CVP are drawn in red and blue, respectively. The diagram for the cross-sectional image at the yellow dot line (right panel) is shown. (B and C) Projection views of confocal z stack images and cross-sectional images of CVP during 36–42 hpf. Wild-type embryos were treated with ATX inhibitor, ONO-8430506, from 36 to 42 hpf and confocal CVP images were taken at indicated time points. Schematic diagrams of the protocol are also shown in the upper side. Images from DMSO (B) or ONO-8430506 (C)-treated embryos are shown. Time-lapse images were shown every 30 min. Scale bars, 100 μm. (D and E) ATX inhibitor treatment induces rapid shrinkage of column structure. (D) Enlarged images of the column structure in the area surrounded by squares in Figures 5B and 5C, showing that the column structure rapidly regresses in a time-dependent manner after ATX inhibitor treatment. (E) Quantitative analysis of the column shrinkage after ATX inhibitor treatment (DMSO n = 4, ONO-8430506 n = 3). Time-dependent changes in the column area. The column area at indicated time points was divided by the column area at 36 hpf, and the resulting relative column area was shown. All data were expressed as means and SD. p value was calculated by the student’s t test (∗p < 0.05; ∗∗p < 0.01; ∗∗∗p < 0.001). (F and G) Rapid CVP expansion in the early phase after ATX inhibitor treatment. At 36 hpf, wild-type embryos were treated with ATX inhibitor, and time-dependent changes of CVP structure in cross-sectional images were taken every 10 min. Arrowheads show the expanded CVP vessels. See also Figure S10 and Video S7. Time-lapse fluorescent microscopic image of wild-type Tg(fli1:EGFP) embryo treated with DMSO in a lateral view, related to Figure 5, Video S8. Time-lapse fluorescent microscopic image of wild-type Tg(fli1:EGFP) embryo treated with DMSO in a cross-sectional view, related to Figure 5, Video S9. Time-lapse fluorescent microscopic image of wild-type Tg(fli1:EGFP) embryo treated with ONO-8430506 (dissolved in DMSO) in a lateral view, related to Figure 5, Video S10. Time-lapse fluorescent microscopic image of wild-type Tg(fli1:EGFP) embryo treated with ONO-8430506 in a cross-sectional view, related to Figure 5, Video S11. Effect of ONO-8430506 treatment on blood flow, related to Figure 5, Video S12. Effect of ONO-8430506 treatment on blood flow, related to Figure 5. |
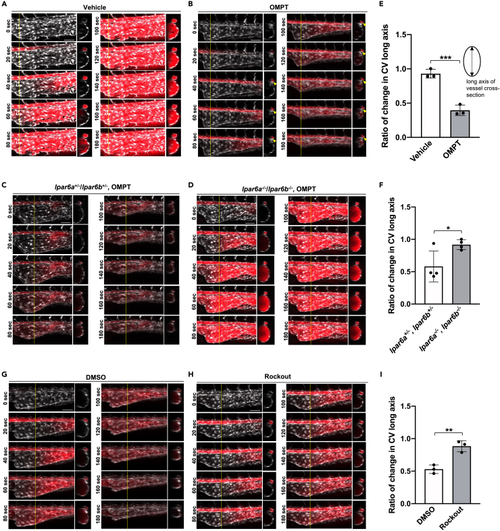
LPA6-dependent constriction of caudal vein plexus (CVP) by an LPA stable analog (A and B) Constriction of CVP induced by OMPT. At 25 hpf, wild-type embryos were treated with ATX inhibitor, ONO-8430506 (100 μM), for eleven hours. At 36 hpf, the embryos were injected with OMPT in the vicinity of the heart. Time-lapse images are taken every 20 s after the injection. The circulation of OMPT is evaluated by the fluorescence of Evans Blue, which is mixed with OMPT. The time-lapse images show that Evans Blue and thus OMPT pass through CA and then reach CVP gradually after they enter the circulation. (B) OMPT rapidly induces shrinkage of CVP as soon as it reaches CVP (B), which is never observed in vehicle control (DMSO, A). OMPT also induces the constriction of CA (arrowheads) (B). Scale bars, 50 μm. (C and D) Constriction of CVP induced by OMPT in lpar6a−/−/lpar6b−/− embryos. Treatment with ATX inhibitor, OMPT injection, and analyses were performed as in A and (B). OMPT rapidly induces shrinkage of CVP in lpar6a+/−/lpar6b+/− embryos (C), which was significantly weakened in lpar6a−/−/lpar6b−/− embryos (D). Scale bars, 50 μm. (E and F) Quantitative evaluation of CVP constriction. The length of the CVP long axis was determined using Zen software from the sectional images of confocal z stack images, and the rate of change in CVP long axis was calculated by dividing the length at time 300 s by that at 0 s (E; OMPT vs. vehicle control (DMSO) and F; lpar6a+/−/lpar6b+/− vs. lpar6a−/−/lpar6b−/−). Data were shown as means ± SD of three-vehicle control and three OMPT-injected embryos for A and B, respectively, and four lpar6a+/−/lpar6b+/− and four lpar6a−/−/lpar6b−/− embryos, respectively. p value was calculated by the student’s t test (∗p < 0.05; ∗∗∗p < 0.001). (G–I) Effect of Rho-kinase inhibitor on OMPT-induced vasoconstriction. Thirty-four hpf embryos were pre-treated with Rockout (100 μM), and OMPT-induced vasoconstriction was evaluated at 36 hpf as in A and B (G, DMSO control and H, Rockout). Scale bars, 50 μm. (I) Quantitative evaluation of CVP constriction was performed as in (E) and (F). Three embryos treated with DMSO and three embryos treated with Rockout were evaluated. All data were expressed as means and SD. p value was calculated by the student’s t test (∗∗p < 0.01). See also Figures S11, S12 and Video S13. LPA6 agonist-induced rapid vasoconstriction (vehicle control), related to Figure 6, Video S14. LPA6 agonist-induced rapid vasoconstriction (OMPT), related to Figure 6, Video S15. LPA6 agonist-induced vasoconstriction in the embryos pre-treated with ONO-8430506 (vehicle control), related to Figure 6, Video S16. LPA6 agonist-induced vasoconstriction in the embryos pre-treated with ONO-8430506 (OMPT), related to Figure 6, Video S17. LPA6 agonist-induced vasoconstriction is weaken in LPA6a/LPA6b DKO embryos (control, lpar6a+/−/lpar6b+/−), related to Figure 6, Video S18. LPA6 agonist-induced vasoconstriction is weaken in LPA6a/LPA6b DKO embryos (LPA6a/LPA6b DKO, lpar6a−/−/lpar6b−/−), related to Figure 6, Video S19. LPA6 agonist-induced vasoconstriction is weakened in the embryos pre-treated with ROCK inhibitor (control, DMSO), related to Figure 6, Video S20. LPA6 agonist-induced vasoconstriction is weakened in the embryos pre-treated with ROCK inhibitor (ROCK inhibitor, Rockout), related to Figure 6. |

Blood flow-induced CVP formation is dependent on ATX (A) Twenty-four hpf embryos were pre-treated with BDM (12 mM) for ten hours by changing the medium to a medium containing BDM, and at 34 hpf the medium was changed to the same medium containing BDM and the sequential time-lapse images were taken for 3 h every 30 min. The CVP structures did not change significantly for 3 h. Scale bars, 100 μm. (B) Twenty-four hpf embryos were pre-treated with BDM as in (A), and at 34 hpf the medium was changed to a medium without BDM and the sequential time-lapse images were taken for 3 h every 30 min. Note that subdivisions of CVP accompanied by constriction of vessels were observed (arrows). Scale bars, 100 μm. (C) Twenty-four hpf embryos were pre-treated with BDM as in (A), and at 34 hpf the medium was changed to a medium without BDM but containing ONO-8430506, and the sequential time-lapse images were taken for 3 h every 30 min. Note that subdivisions and constriction of CVP were significantly suppressed. Scale bars, 100 μm. (D) Ratio of somites with CVP subdivision was quantified by evaluating ten somites (somite a–j in See also |
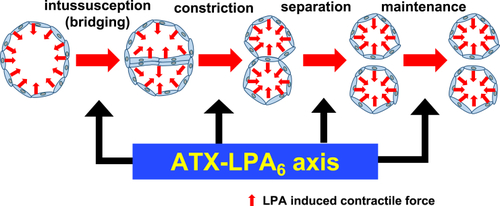
A proposed model explaining the role of ATX-LPA6 axis in formation and maintenance of plexus vessels Plexus vessels are formed from pre-existing vessels both by sprouting and intussusceptive angiogenesis and the following constriction and separation of two pre-formed vessels. The present study proposes that an ATX-LPA6 axis contributes to vessels' constriction and separation, and also to maintain formed vessels downstream of ATX-LPA6-Gα13 signaling. |
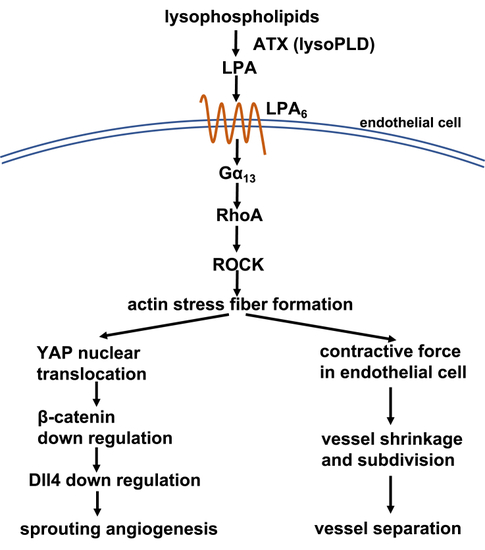
Schematic diagram of the expected function of ATX-LPA6-Gα13-ROCK axis in CVP formation LPA produced by ATX activates the LPA6 receptor on endothelial cells, which induces actin stress fiber formation via Gα13, RhoA, and ROCK pathway. Actin stress fiber formation is then stimulated and contributes to (1) activation of Yap transcription factor leading to sprouting angiogenesis via β-catenin and Notch signaling pathways, (2) generation of contractile forces on ECs in developing plexus vessels leading to vessel subdivision and separation. |