
|
Figure 2
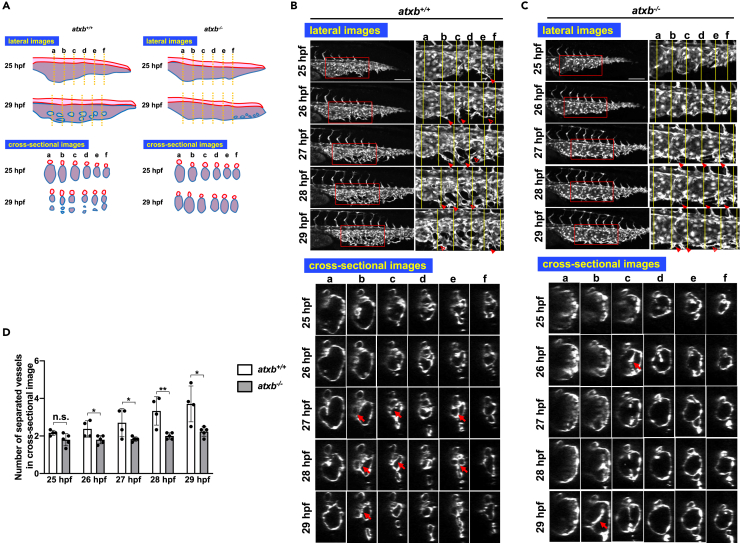
Abnormal vessel segmentation in ATXb KO embryos
(A) Schematic diagrams explaining the phenotype of ATXb KO embryos. DA and CVP are drawn in red and blue, respectively. The diagrams for cross-sectional images at the yellow dot line (lower panel) are shown, indicating that ATXb KO embryos have large and sac-like CVP.
(B and C) Sequential time-lapse images of wild-type (atxb+/+) (B) and atxb−/− (C) embryos at the indicated time points. Both projection views from the lateral side (upper panel) and cross-sectional images (lower panel) are shown. Enlarged images of the area surrounded by squares in lateral images are positioned in the right side (upper panel). In atxb+/+ embryos, endothelial cells (ECs) sprout ventrally from the CV (dCVP primordia) and anastomose each other (upper panel). Arrowheads and hollow arrowheads indicate sprouting and anastomosing (rejoining) EC cells, respectively. The sectional images at the six somites (a to f) (lower panel) show that the subdivision of dCVP proceeds in time dependent manner. In this process, ECs sprout into the CV lumen and form a cross-linked (bridging) structure (shown by arrows). Then, CV constriction and subdivision proceed in parallel. In an atxb−/− embryo (C), we observed extremely little vessel subdivision, which results in remaining of large lumens. Note that both EC sprouting and the sign of forming the bridging structure are still observed, even less frequently. Scale bars, 100 μm.
(D) Numbers of separated vessels surrounded by endothelial cells in a cross section (somite a–f in Figures 2B and 2C) at the indicated timepoints. Four wild-type (atxb+/+) and five ATXb homozygous (atxb−/−) embryos were evaluated. All data were expressed as means and SD. p value was calculated by the student’s t test (∗p < 0.05; ∗∗p < 0.01; n.s., no significance).
See also Video S3. Time-lapse fluorescent microscopic image of wild-type Tg(fli1:EGFP) embryo in a lateral view, related to Figure 2, Video S4. Time-lapse fluorescent microscopic image of wild-type Tg(fli1:EGFP) embryo in a cross-sectional view, related to Figure 2, Video S5. Time-lapse fluorescent microscopic image of ATXb KO (atxb−/−) Tg(fli1:EGFP) embryo in a lateral view, related to Figure 2.