
Figure 6
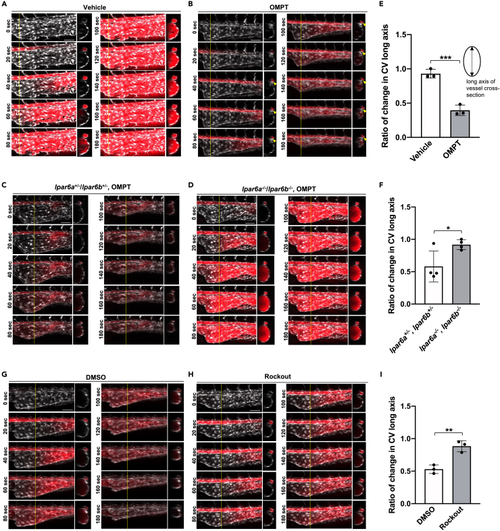
LPA6-dependent constriction of caudal vein plexus (CVP) by an LPA stable analog (A and B) Constriction of CVP induced by OMPT. At 25 hpf, wild-type embryos were treated with ATX inhibitor, ONO-8430506 (100 μM), for eleven hours. At 36 hpf, the embryos were injected with OMPT in the vicinity of the heart. Time-lapse images are taken every 20 s after the injection. The circulation of OMPT is evaluated by the fluorescence of Evans Blue, which is mixed with OMPT. The time-lapse images show that Evans Blue and thus OMPT pass through CA and then reach CVP gradually after they enter the circulation. (B) OMPT rapidly induces shrinkage of CVP as soon as it reaches CVP (B), which is never observed in vehicle control (DMSO, A). OMPT also induces the constriction of CA (arrowheads) (B). Scale bars, 50 μm. (C and D) Constriction of CVP induced by OMPT in lpar6a−/−/lpar6b−/− embryos. Treatment with ATX inhibitor, OMPT injection, and analyses were performed as in A and (B). OMPT rapidly induces shrinkage of CVP in lpar6a+/−/lpar6b+/− embryos (C), which was significantly weakened in lpar6a−/−/lpar6b−/− embryos (D). Scale bars, 50 μm. (E and F) Quantitative evaluation of CVP constriction. The length of the CVP long axis was determined using Zen software from the sectional images of confocal z stack images, and the rate of change in CVP long axis was calculated by dividing the length at time 300 s by that at 0 s (E; OMPT vs. vehicle control (DMSO) and F; lpar6a+/−/lpar6b+/− vs. lpar6a−/−/lpar6b−/−). Data were shown as means ± SD of three-vehicle control and three OMPT-injected embryos for A and B, respectively, and four lpar6a+/−/lpar6b+/− and four lpar6a−/−/lpar6b−/− embryos, respectively. p value was calculated by the student’s t test (∗p < 0.05; ∗∗∗p < 0.001). (G–I) Effect of Rho-kinase inhibitor on OMPT-induced vasoconstriction. Thirty-four hpf embryos were pre-treated with Rockout (100 μM), and OMPT-induced vasoconstriction was evaluated at 36 hpf as in A and B (G, DMSO control and H, Rockout). Scale bars, 50 μm. (I) Quantitative evaluation of CVP constriction was performed as in (E) and (F). Three embryos treated with DMSO and three embryos treated with Rockout were evaluated. All data were expressed as means and SD. p value was calculated by the student’s t test (∗∗p < 0.01). See also Figures S11, S12 and Video S13. LPA6 agonist-induced rapid vasoconstriction (vehicle control), related to Figure 6, Video S14. LPA6 agonist-induced rapid vasoconstriction (OMPT), related to Figure 6, Video S15. LPA6 agonist-induced vasoconstriction in the embryos pre-treated with ONO-8430506 (vehicle control), related to Figure 6, Video S16. LPA6 agonist-induced vasoconstriction in the embryos pre-treated with ONO-8430506 (OMPT), related to Figure 6, Video S17. LPA6 agonist-induced vasoconstriction is weaken in LPA6a/LPA6b DKO embryos (control, lpar6a+/−/lpar6b+/−), related to Figure 6, Video S18. LPA6 agonist-induced vasoconstriction is weaken in LPA6a/LPA6b DKO embryos (LPA6a/LPA6b DKO, lpar6a−/−/lpar6b−/−), related to Figure 6, Video S19. LPA6 agonist-induced vasoconstriction is weakened in the embryos pre-treated with ROCK inhibitor (control, DMSO), related to Figure 6, Video S20. LPA6 agonist-induced vasoconstriction is weakened in the embryos pre-treated with ROCK inhibitor (ROCK inhibitor, Rockout), related to Figure 6. |