
Figure 5
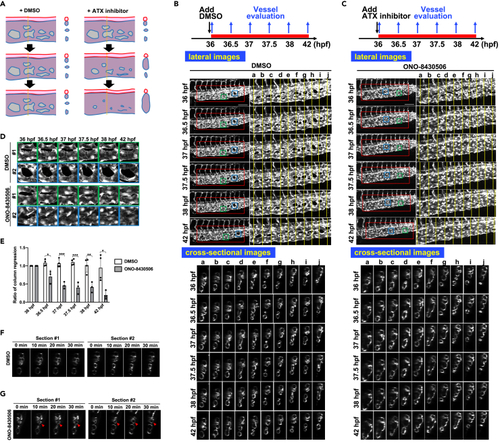
ATX has a role in maintaining CVP structure (A) Schematic diagram explaining the effect of ATX inhibition on CVP structure. DA and CVP are drawn in red and blue, respectively. The diagram for the cross-sectional image at the yellow dot line (right panel) is shown. (B and C) Projection views of confocal z stack images and cross-sectional images of CVP during 36–42 hpf. Wild-type embryos were treated with ATX inhibitor, ONO-8430506, from 36 to 42 hpf and confocal CVP images were taken at indicated time points. Schematic diagrams of the protocol are also shown in the upper side. Images from DMSO (B) or ONO-8430506 (C)-treated embryos are shown. Time-lapse images were shown every 30 min. Scale bars, 100 μm. (D and E) ATX inhibitor treatment induces rapid shrinkage of column structure. (D) Enlarged images of the column structure in the area surrounded by squares in Figures 5B and 5C, showing that the column structure rapidly regresses in a time-dependent manner after ATX inhibitor treatment. (E) Quantitative analysis of the column shrinkage after ATX inhibitor treatment (DMSO n = 4, ONO-8430506 n = 3). Time-dependent changes in the column area. The column area at indicated time points was divided by the column area at 36 hpf, and the resulting relative column area was shown. All data were expressed as means and SD. p value was calculated by the student’s t test (∗p < 0.05; ∗∗p < 0.01; ∗∗∗p < 0.001). (F and G) Rapid CVP expansion in the early phase after ATX inhibitor treatment. At 36 hpf, wild-type embryos were treated with ATX inhibitor, and time-dependent changes of CVP structure in cross-sectional images were taken every 10 min. Arrowheads show the expanded CVP vessels. See also Figure S10 and Video S7. Time-lapse fluorescent microscopic image of wild-type Tg(fli1:EGFP) embryo treated with DMSO in a lateral view, related to Figure 5, Video S8. Time-lapse fluorescent microscopic image of wild-type Tg(fli1:EGFP) embryo treated with DMSO in a cross-sectional view, related to Figure 5, Video S9. Time-lapse fluorescent microscopic image of wild-type Tg(fli1:EGFP) embryo treated with ONO-8430506 (dissolved in DMSO) in a lateral view, related to Figure 5, Video S10. Time-lapse fluorescent microscopic image of wild-type Tg(fli1:EGFP) embryo treated with ONO-8430506 in a cross-sectional view, related to Figure 5, Video S11. Effect of ONO-8430506 treatment on blood flow, related to Figure 5, Video S12. Effect of ONO-8430506 treatment on blood flow, related to Figure 5. |