
|
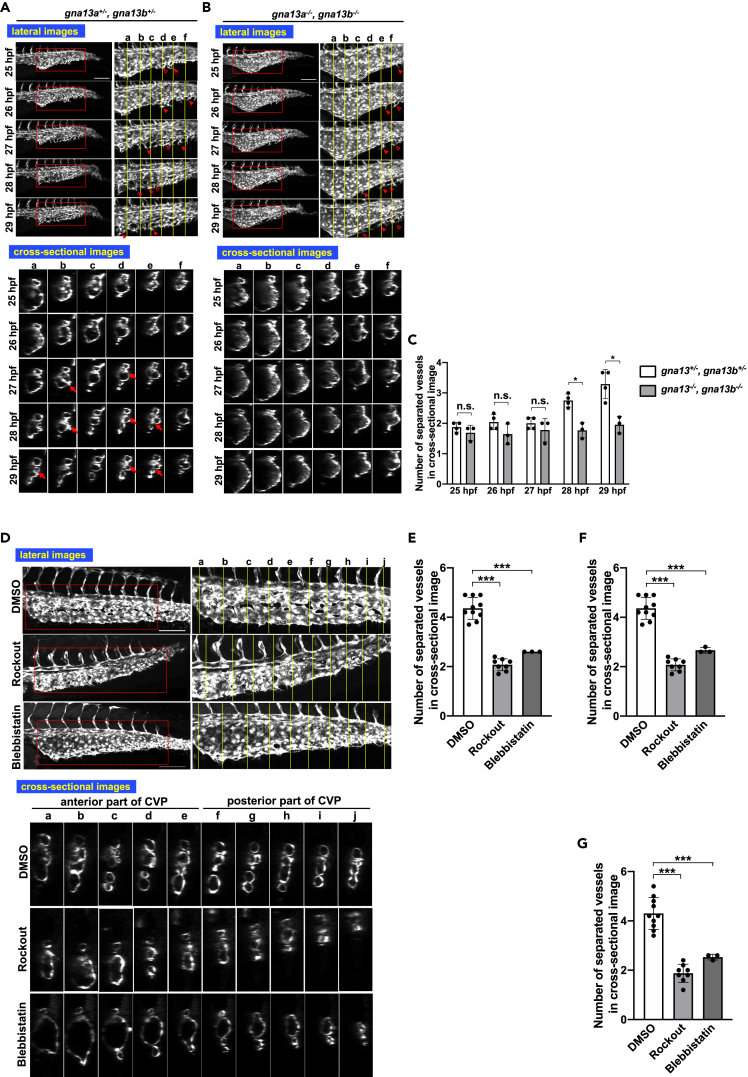
Figure 4
Similar abnormal CVP structure in gna13a/gna13b double mutant embryos and embryos treated with inhibitors of actin stress fiber formation
(A, B, and D) All images are projection views of confocal z stack images and cross-sectional images of CVP. Scale bars, 100 μm. For (D), inhibitors were added at 24 hpf and images were taken at 36 hpf. (A and B) Images of control (gna13a+/−/gna13b+/−) and gna13a/gna13b double KO (gna13a−/−/gna13b−/−) embryos were taken from 25 hpf to 29 hpf. Arrowheads and hollow arrowheads indicate sprouts and anastomosed (re-joined) sprouts, respectively. Cross-linked structure formed in lumen is pointed with arrows.
(C) Numbers of separated vessels surrounded by endothelial cells in a cross section (somite a–f in A and B) at the indicated timepoints. Four gna13a+/−/gna13b+/− and three gna13a−/−/gna13b−/− embryos were evaluated. All data were expressed as means and SD. p value was calculated by the student’s t test (∗p < 0.05; ∗∗p < 0.01; n.s., no significance). (D) Embryo treated with DMSO only (negative control), ROCK inhibitor (Rockout), or inhibitor of stress fiber formation (Blebbistatin). Note that the vessel subdivision is rarely observed in the anterior somites in gna13a−/−/gna13b−/− embryos and in embryos treated with Rockout and Blebbistatin.
(E–G) Numbers of separated vessels surrounded by endothelial cells in a cross section (somite a–f in D) from three to ten embryos (DMSO n = 10, Rockout n = 3, Blebbistatin n = 8). The anterior somites a–e (E), the posterior somites f–j (F) and all somites (a–j) (G) were evaluated. All data were expressed as means and SD. p value was calculated by the student’s t test (∗∗∗p < 0.001). See also Figure S8.