
- Title
-
The TGFβ/Notch axis facilitates Müller cell-to-epithelial transition to ultimately form a chronic glial scar
- Authors
- Conedera, F.M., Pousa, A.M.Q., Mercader, N., Tschopp, M., Enzmann, V.
- Source
- Full text @ Mol. Neurodegener.
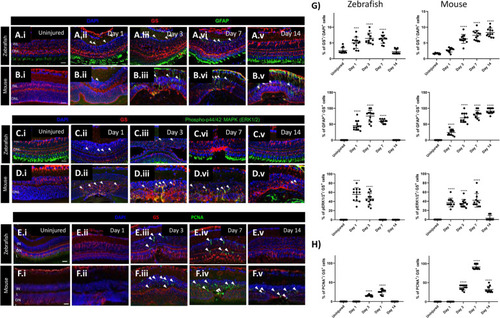
Cross-species comparison of MC gliosis in response to laser injury. (A-E) Analysis of MC gliotic response in zebrafish and mice at baseline (Uninjured) and different time point after injury (Day 1, 3, 7 and 14). Detection of GFAP in GS+MCs after laser induction in zebrafish (A.i-A.v) and mice (B.i-B.v). Shown are sections for GS (red) and GFAP (green). Detection of phospho-Erk1/2 in GS+MCs after injury and in uninjured zebrafish (C.i-C.v) and mice (D.i-D.v). Shown are sections for GS (red) and phospho-Erk1/2 (green). Histograms illustrating mean ± SD of GS+, GFAP+ and pERK1/2+cells normalized by the total of DAPI+ or GS+ cells in percentage (G). Significant differences (*** |
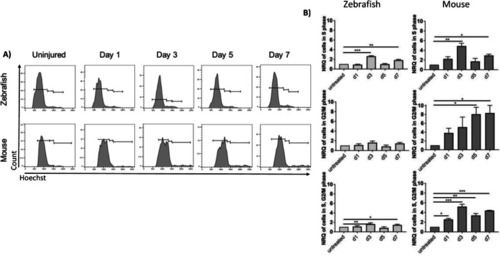
Analysis of cellular DNA content. ( |
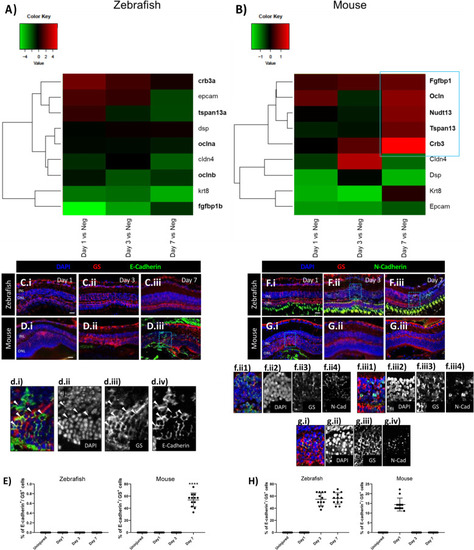
Difference of MC injury response in zebrafish and mice. (A, B) Heatmaps of differentially expressed genes (DEGs) associated with an epithelial phenotype in sorted cycling zebrafish and murine MCs. The blue box groups the most significant genes with the highest upregulation. (C-H) Analysis of MC phenotype in zebrafish and mice at the baseline (Uninjured) and at different time points after injury (Day 1, 3, and 7). Detection of E-cadherin in GS+ MCs after laser induction in zebrafish (C.i-C.iii) and mice (D.i-D.iii). Shown are retinal sections stained for GS (red) and E-cadherin (green). Zoomed-in view of murine GS+/E-cadherin+ cells of the area defined by a blue frame at Day 7 (d.i-d.iv). White arrowheads mark double-positive cells. (E) Histograms illustrating the mean ± SD of the number of E-cadherin+ cells normalized by the total number of GS+ cells expressed in percentage. Significant differences (****p < 0.0001) between uninjured and injured retinas were determined by using a post-hoc Bonferroni one-way ANOVA test ( |
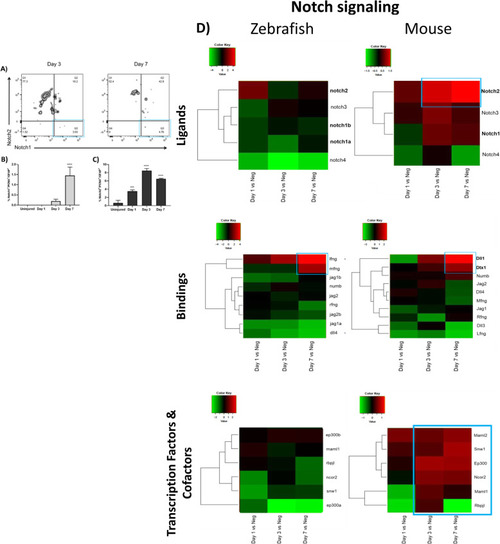
Investigation of Notch pathway during MET in murine MCs. Flow cytometry analysis of Notch isoforms in reactive MCs in mouse at the baseline (Uninjured) and at different time points after injury (Day 1, 3 and 7). ( |

Human MCs show epithelial phenotype associated with TGFβ/Notch under pathological condition. (A) Human H&E stained sections of retinas that show healthy cuboidal RPE (Neg) and retinas presenting drusen beneath the pigment epithelium (Drusen pos). Zoom-in view showing a healthy cuboidal RPE layer (Neg, top left corner) and drusen or micro drusen underneath the RPE layer (Drusen pos, top left corner). (B) Quantification of drusen as either hyalinized rounded deposits (> 25 μm) or micro drusen occurring singly or in a row (< 25 μm) in between the RPE and the Bruch’s membrane. The analyzed length of the retina was 950 μm retina sections corresponding to the field of view. (C) Table summarizing the eight selected samples (total analyzed sections = 52) selected for H&E and immunofluorescence analysis. (D-J) Analysis of MC reactivity and phenotype of healthy retinas (Neg) and retinas presenting drusen (Drusen pos). Detection of GFAP (D.i-D.iv, E.i-E.iv), PCNA (F.i-F.iv, G.i-G.iv) and E-cadherin (H.i-H.iv, I.i-I.iv) in GS+ MCs. Shown are representative sections stained for GS and SOX9 (red), GFAP, PCNA and E-Cadherin (green). (J) Histogram illustrating the mean ± SD of the number of GFAP+, PCNA+ and E-cadherin+ cells normalized by the total number of GS+ cells expressed in percentage. Significant differences (****p < 0.0001) between “Neg” and “Drusen pos” retinas were determined by using a post-hoc Bonferroni two-way ANOVA test ( |
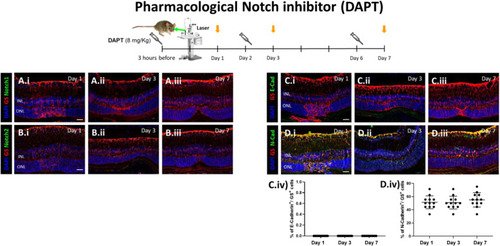
Pharmacological Notch inhibition (DAPT) increases N-cadherin expression. Mice were treated with DAPT (8 mg/kg) by intraperitoneal injection either at 3 h before injury, at day 2 or at day 6 (syringes) and euthanized 24 h after injection (orange arrows; Day 1, 3, 7, respectively). (A-B) Analysis of Notch isoforms during MC injury response in DAPT treated mice at different time points (Day 1, 3 and 7). Detection of Notch1 (A.i-A.iii) and Notch2 (B.i-B.iii) in GS+ MCs. Shown are representative sections stained for GS (red), Notch1/2 (green). (C-D) Analysis of MC phenotype during injury response in DAPT treated mice at different time points (Day 1, 3 and 7). Detection of E-cadherin (C.i-C.iii) and N-cadherin (D.i-D.iii) in GS+ MCs. Shown are representative sections stained for GS (red), E- and N-cadherin (green). (C.iv, D.iv) Histograms illustrating the mean ± SD of the number of Notch1+ and Notch2+ cells normalized by the total number of GS+ cells expressed in percentage ( |
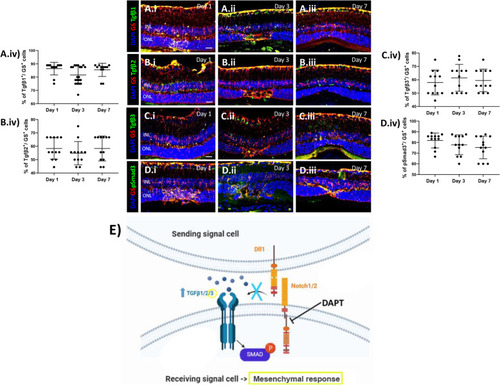
Pharmacological Notch inhibition (DAPT) increases TGFβ3 expression. (A-D) Analysis of TGFβ pathway during MC injury response in DAPT treated mice at different time points (Day 1, 3 and 7). Detection of TGFβ1 (A.i-A.iii), TGFβ2 (B.i-B.iii), TGFβ3 (C.i-C.iii) and p-Smad3 (D.i-D.iii) in GS+ MCs. Shown are representative sections stained for GS (red), TGFβ1/2/3 and p-Smad3 (green). (A.iv, B.iv, C.iv, D.iv) Histograms illustrating the mean ± SD of the number of TGFβ1, TGFβ2 and TGFβ3+ cells normalized by the total number of GS+ cells expressed in percentage (n = 12). INL, inner nuclear layer; ONL, outer nuclear layer. Scale bar of all images equals 50 μm. (E) Schematic summary of molecular outcomes of DAPT treatment in murine MCs |
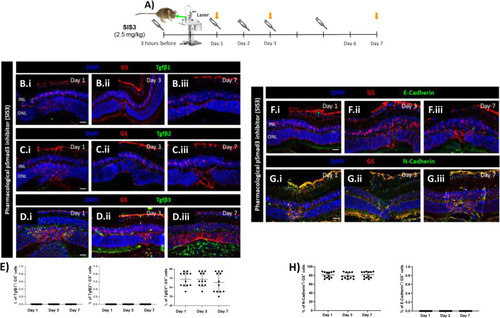
Pharmacological inhibition of p-Smad3 (SIS3) increase TGFβ3 and N-cadherin. (A) SIS3treated mice treated at 3 h before injury, at day 2 or at day 6 (syringes) and euthanized 24 h after injection (orange arrows; Day 1, 3, 7, respectively). (B-E) MC reactivity in SIS3 treated mice. Detection of TGFβ1 (B.i-B.iii), TGFβ2 (C.i-C.iii) and TGFβ3 (D.i-D.iii) in GS+MCs. Shown are representative sections for GS (red) and TGFβ1/2/3 (green). Histograms illustrating mean ± SD of TGFβ1, TGFβ2 and TGFβ3+cells normalized by total of GS+cells (E; n = 12). (F-H) MC phenotype in SIS3 treated mice. Detection of E-cadherin (F.i-F.iii) and N-cadherin (G.i-G.iii) in GS+MCs. Shown are representative sections stained for GS (red) as well as E- and N-cadherin (green). Histograms illustrating mean ± SD of E-cadherin+/N-cadherin+ cells normalized by the total of GS+ cells (H; n = 12) |
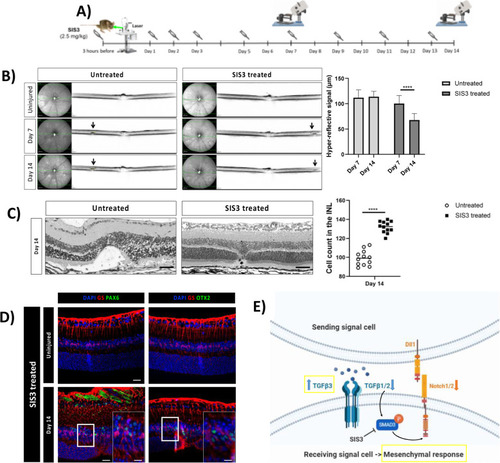
Pharmacological inhibition of p-Smad3 (SIS3) diminishes retinal damage. ( |