
Fig. 6
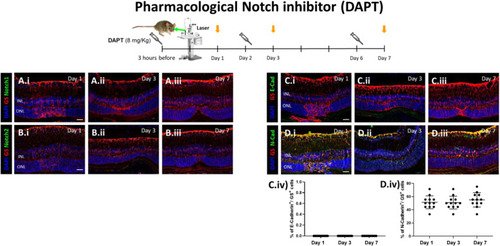
Pharmacological Notch inhibition (DAPT) increases N-cadherin expression. Mice were treated with DAPT (8 mg/kg) by intraperitoneal injection either at 3 h before injury, at day 2 or at day 6 (syringes) and euthanized 24 h after injection (orange arrows; Day 1, 3, 7, respectively). (A-B) Analysis of Notch isoforms during MC injury response in DAPT treated mice at different time points (Day 1, 3 and 7). Detection of Notch1 (A.i-A.iii) and Notch2 (B.i-B.iii) in GS+ MCs. Shown are representative sections stained for GS (red), Notch1/2 (green). (C-D) Analysis of MC phenotype during injury response in DAPT treated mice at different time points (Day 1, 3 and 7). Detection of E-cadherin (C.i-C.iii) and N-cadherin (D.i-D.iii) in GS+ MCs. Shown are representative sections stained for GS (red), E- and N-cadherin (green). (C.iv, D.iv) Histograms illustrating the mean ± SD of the number of Notch1+ and Notch2+ cells normalized by the total number of GS+ cells expressed in percentage ( |