
|
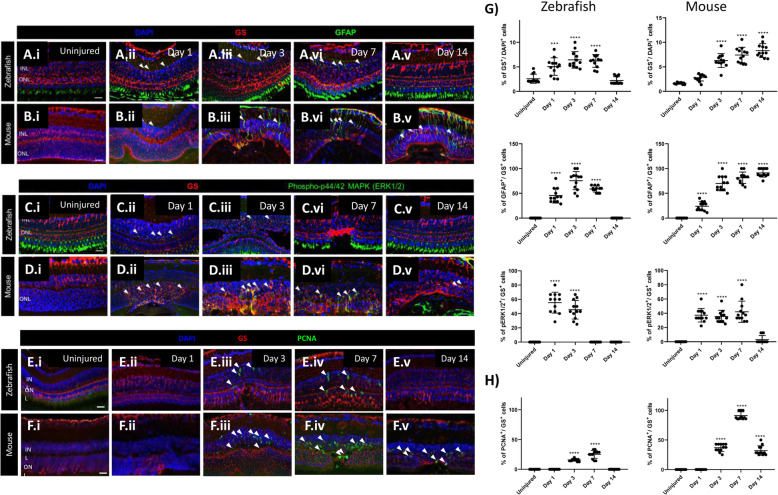
Fig. 1
Cross-species comparison of MC gliosis in response to laser injury. (A-E) Analysis of MC gliotic response in zebrafish and mice at baseline (Uninjured) and different time point after injury (Day 1, 3, 7 and 14). Detection of GFAP in GS+MCs after laser induction in zebrafish (A.i-A.v) and mice (B.i-B.v). Shown are sections for GS (red) and GFAP (green). Detection of phospho-Erk1/2 in GS+MCs after injury and in uninjured zebrafish (C.i-C.v) and mice (D.i-D.v). Shown are sections for GS (red) and phospho-Erk1/2 (green). Histograms illustrating mean ± SD of GS+, GFAP+ and pERK1/2+cells normalized by the total of DAPI+ or GS+ cells in percentage (G). Significant differences (***