
|
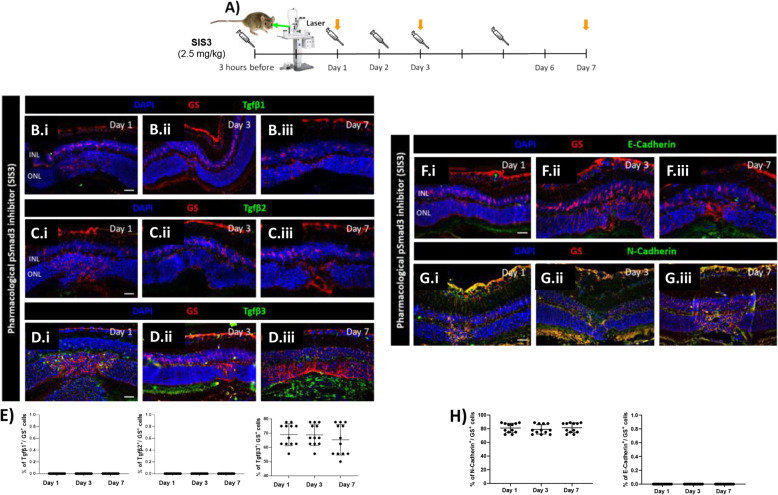
Fig. 8
Pharmacological inhibition of p-Smad3 (SIS3) increase TGFβ3 and N-cadherin. (A) SIS3treated mice treated at 3 h before injury, at day 2 or at day 6 (syringes) and euthanized 24 h after injection (orange arrows; Day 1, 3, 7, respectively). (B-E) MC reactivity in SIS3 treated mice. Detection of TGFβ1 (B.i-B.iii), TGFβ2 (C.i-C.iii) and TGFβ3 (D.i-D.iii) in GS+MCs. Shown are representative sections for GS (red) and TGFβ1/2/3 (green). Histograms illustrating mean ± SD of TGFβ1, TGFβ2 and TGFβ3+cells normalized by total of GS+cells (E; n = 12). (F-H) MC phenotype in SIS3 treated mice. Detection of E-cadherin (F.i-F.iii) and N-cadherin (G.i-G.iii) in GS+MCs. Shown are representative sections stained for GS (red) as well as E- and N-cadherin (green). Histograms illustrating mean ± SD of E-cadherin+/N-cadherin+ cells normalized by the total of GS+ cells (H; n = 12)