
|
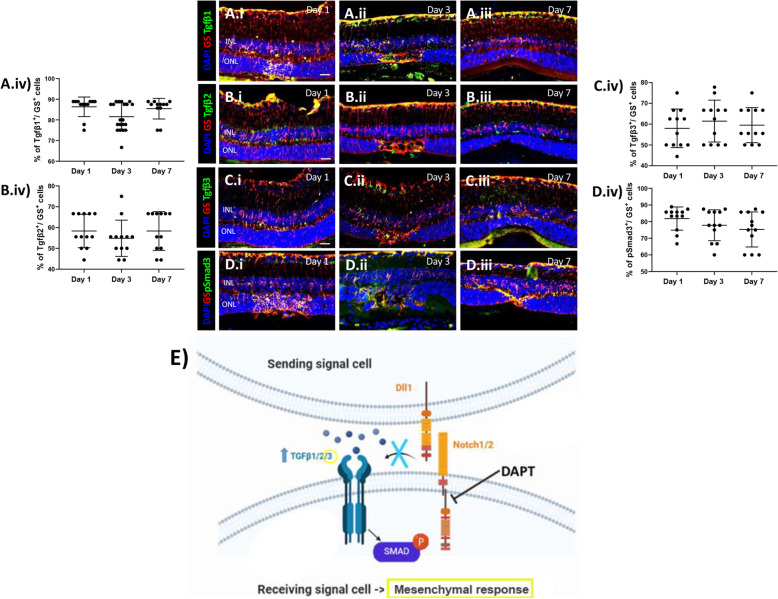
Fig. 7
Pharmacological Notch inhibition (DAPT) increases TGFβ3 expression. (A-D) Analysis of TGFβ pathway during MC injury response in DAPT treated mice at different time points (Day 1, 3 and 7). Detection of TGFβ1 (A.i-A.iii), TGFβ2 (B.i-B.iii), TGFβ3 (C.i-C.iii) and p-Smad3 (D.i-D.iii) in GS+ MCs. Shown are representative sections stained for GS (red), TGFβ1/2/3 and p-Smad3 (green). (A.iv, B.iv, C.iv, D.iv) Histograms illustrating the mean ± SD of the number of TGFβ1, TGFβ2 and TGFβ3+ cells normalized by the total number of GS+ cells expressed in percentage (n = 12). INL, inner nuclear layer; ONL, outer nuclear layer. Scale bar of all images equals 50 μm. (E) Schematic summary of molecular outcomes of DAPT treatment in murine MCs