IMAGE

Fig. 4

ID
ZDB-IMAGE-211007-12
Source
Figures for Conedera et al., 2021
Image
Figure Caption

Fig. 4

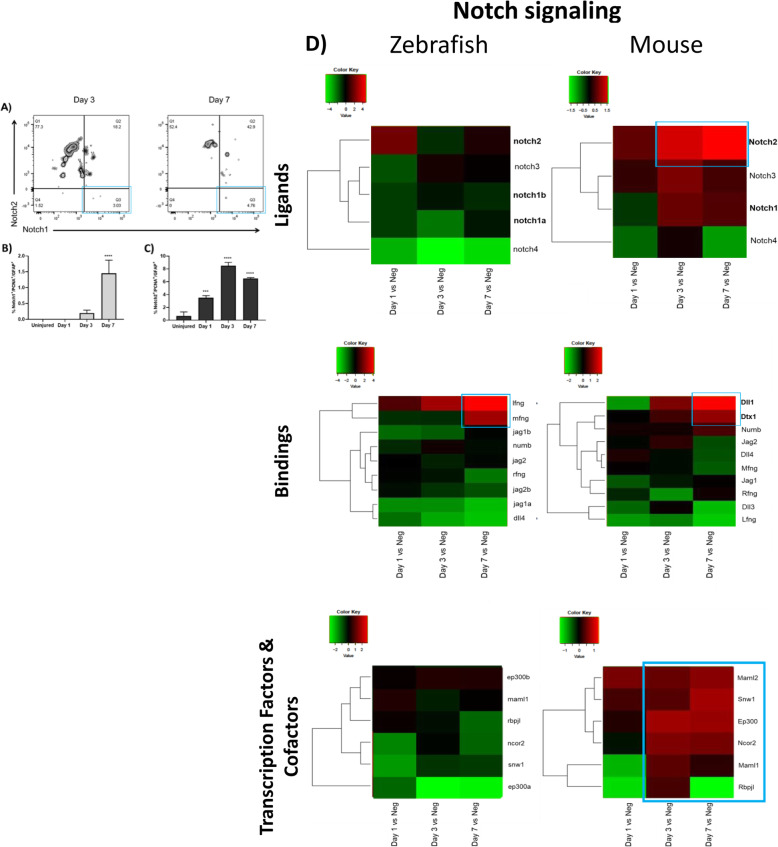
Investigation of Notch pathway during MET in murine MCs. Flow cytometry analysis of Notch isoforms in reactive MCs in mouse at the baseline (Uninjured) and at different time points after injury (Day 1, 3 and 7). (A) Representative figures of MCs gated for GFAP and PCNA and further for Notch1/2 at Day 3 and 7. (B-C) Histograms illustrating the mean ± SD of the number of GFAP+/PCNA+/Notch1+ cells (B) and GFAP+/PCNA+/Notch2+ cells (C) normalized by the total number of GFAP+/PCNA+ cells expressed in percentage. Significant differences (***p < 0.001 and ****p < 0.0001) between uninjured, Day 1, 3 and 7 were determined by using a post-hoc Bonferroni one-way ANOVA test (n = 12). (D) Heatmaps of receptors, ligands and transcription factors and cofactors of Notch signaling differentially expressed in sorted cycling zebrafish and murine MCs. Data are expressed as fold-changes compared to negative controls (cycling Müller from uninjured retinas). The blue boxes group the most significant genes with the highest upregulation

Acknowledgments
This image is the copyrighted work of the attributed author or publisher, and ZFIN has permission only to display this image to its users. Additional permissions should be obtained from the applicable author or publisher of the image. Full text @ Mol. Neurodegener.