
|
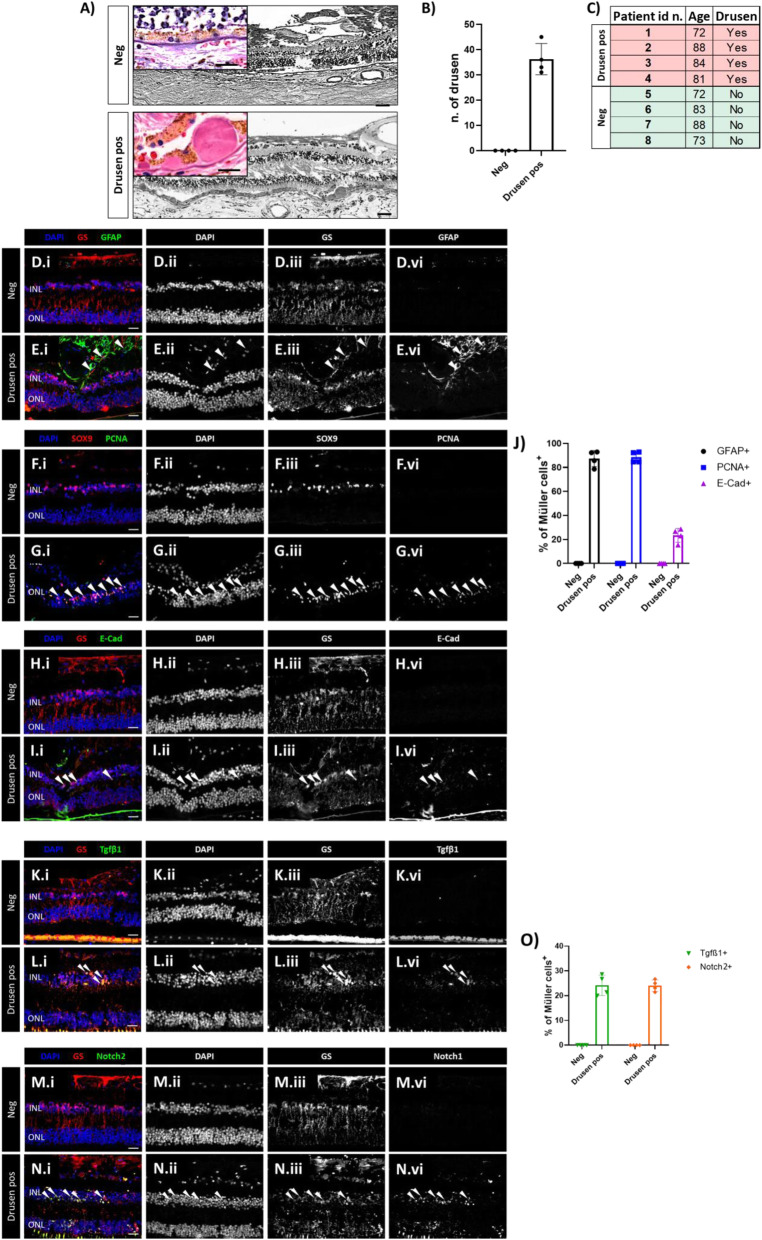
Fig. 5
Human MCs show epithelial phenotype associated with TGFβ/Notch under pathological condition. (A) Human H&E stained sections of retinas that show healthy cuboidal RPE (Neg) and retinas presenting drusen beneath the pigment epithelium (Drusen pos). Zoom-in view showing a healthy cuboidal RPE layer (Neg, top left corner) and drusen or micro drusen underneath the RPE layer (Drusen pos, top left corner). (B) Quantification of drusen as either hyalinized rounded deposits (> 25 μm) or micro drusen occurring singly or in a row (< 25 μm) in between the RPE and the Bruch’s membrane. The analyzed length of the retina was 950 μm retina sections corresponding to the field of view. (C) Table summarizing the eight selected samples (total analyzed sections = 52) selected for H&E and immunofluorescence analysis. (D-J) Analysis of MC reactivity and phenotype of healthy retinas (Neg) and retinas presenting drusen (Drusen pos). Detection of GFAP (D.i-D.iv, E.i-E.iv), PCNA (F.i-F.iv, G.i-G.iv) and E-cadherin (H.i-H.iv, I.i-I.iv) in GS+ MCs. Shown are representative sections stained for GS and SOX9 (red), GFAP, PCNA and E-Cadherin (green). (J) Histogram illustrating the mean ± SD of the number of GFAP+, PCNA+ and E-cadherin+ cells normalized by the total number of GS+ cells expressed in percentage. Significant differences (****p < 0.0001) between “Neg” and “Drusen pos” retinas were determined by using a post-hoc Bonferroni two-way ANOVA test (