FIGURE

Fig. 2

ID
ZDB-FIG-211007-7
Publication
Conedera et al., 2021 - The TGFβ/Notch axis facilitates Müller cell-to-epithelial transition to ultimately form a chronic glial scar
Other Figures
All Figure Page
Back to All Figure Page
Fig. 2

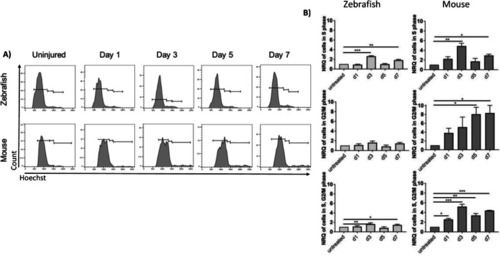
Analysis of cellular DNA content. (A) Flow cytometry of cellular DNA content (Hoechst) of zebrafish gfap:gfap-GFP+ and murine Rlbp1:GFP+ MCs. (B) Representative histograms illustrating mean ± SD of Hoechst+ cells in the different phases of the cell cycle normalized by the total of GFP+MCs in percentage at different time points (Day 1, 3, 5 and 7). Significant differences (*p < 0.05, **p < 0.01 and ***p < 0.001) between uninjured and injured at the different time points were determined by post-hoc Bonferroni one-way ANOVA test (n = 12). INL, inner nuclear layer; ONL, outer nuclear layer. Scale bar of the images equals 50 μm

Expression Data

Expression Detail
Antibody Labeling
Phenotype Data

Phenotype Detail
Acknowledgments
This image is the copyrighted work of the attributed author or publisher, and ZFIN has permission only to display this image to its users. Additional permissions should be obtained from the applicable author or publisher of the image. Full text @ Mol. Neurodegener.