FIGURE

Fig. 3

ID
ZDB-FIG-211007-8
Publication
Conedera et al., 2021 - The TGFβ/Notch axis facilitates Müller cell-to-epithelial transition to ultimately form a chronic glial scar
Other Figures
All Figure Page
Back to All Figure Page
Fig. 3

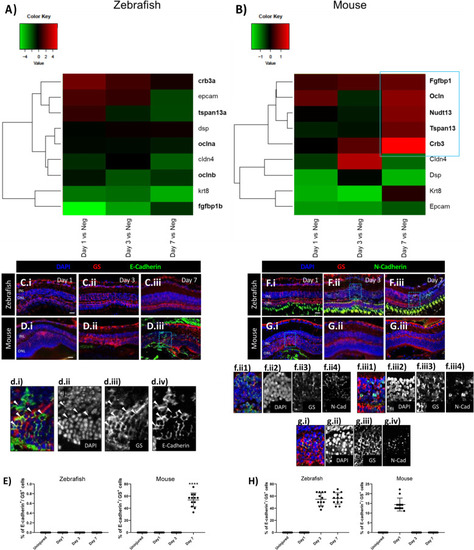
Difference of MC injury response in zebrafish and mice. (A, B) Heatmaps of differentially expressed genes (DEGs) associated with an epithelial phenotype in sorted cycling zebrafish and murine MCs. The blue box groups the most significant genes with the highest upregulation. (C-H) Analysis of MC phenotype in zebrafish and mice at the baseline (Uninjured) and at different time points after injury (Day 1, 3, and 7). Detection of E-cadherin in GS+ MCs after laser induction in zebrafish (C.i-C.iii) and mice (D.i-D.iii). Shown are retinal sections stained for GS (red) and E-cadherin (green). Zoomed-in view of murine GS+/E-cadherin+ cells of the area defined by a blue frame at Day 7 (d.i-d.iv). White arrowheads mark double-positive cells. (E) Histograms illustrating the mean ± SD of the number of E-cadherin+ cells normalized by the total number of GS+ cells expressed in percentage. Significant differences (****p < 0.0001) between uninjured and injured retinas were determined by using a post-hoc Bonferroni one-way ANOVA test (n = 12). Detection of N-Cadherin in GS+ MCs after laser induction in zebrafish (F.i-F.iii) and mice (G.i-G.iii). Shown are retinal sections stained for GS (red) and N-Cadherin (green). Zoomed-in view of zebrafish GS+/N-Cadherin+ cells of the area defined by a blue frame at Day 3 and 7 (f.ii1-f.ii4, f.iii1-f.iii4). Zoomed-in view of murine GS+/N-Cadherin+ cells of the area defined by a blue frame at Day 1 (g.i-g.iv). White arrowheads mark double-positive cells. (H) Histograms illustrating the mean ± SD of the number of N-Cadherin+ cells normalized by the total number of GS+ cells expressed in percentage. Significant differences (****p < 0.0001) between uninjured and injured retinas were determined by using a post-hoc Bonferroni one-way ANOVA test (n = 12)

Expression Data

Expression Detail
Antibody Labeling
Phenotype Data

Phenotype Detail
Acknowledgments
This image is the copyrighted work of the attributed author or publisher, and ZFIN has permission only to display this image to its users. Additional permissions should be obtained from the applicable author or publisher of the image. Full text @ Mol. Neurodegener.