
- Title
-
The effect of absent blood flow on the zebrafish cerebral and trunk vasculature
- Authors
- Kugler, E., Snodgrass, R., Bowley, G., Plant, K., Serbanovic-Canic, J., Hamilton, N., Evans, P.C., Chico, T., Armitage, P.
- Source
- Full text @ Vasc Biol
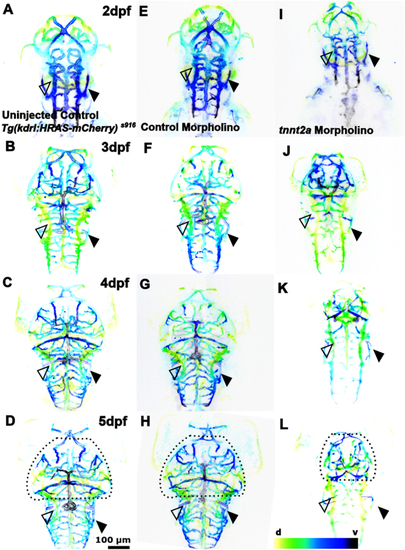
The effect of tnnt2a morpholino knockdown on cerebral vessel development. (A, B, C and D) Cerebral vasculature from 2 to 5dpf in Tg(kdrl:HRAS-mCherry)s916 uninjected animals. (E, F, G and H) Cerebral vasculature in control MO-injected animals. (I, J, K and L) Cerebral vasculature in tnnt2a MO injected animals (n = 7–10; two experimental repeats). The lack of blood flow in tnnt2a morphants perturbs vascular development and worsens over time. Comparison between treatment groups shows that the midbrain vasculature is severely affected in tnnt2a MO (dotted lines) and the PCV surrounding the OV is enlarged (filled arrowhead), while the PHBC appears normal (unfilled arrowhead; d – dorsal, v – ventral; representative images colour-coded by depth). |
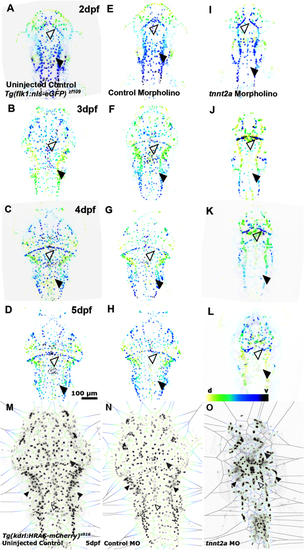
Lack of blood flow impacts cerebral EC number. (A, B, C and D) Cerebral EC nuclei from 2 to 5dpf in Tg(flk1:nls-eGFP)zf109 uninjected control. (E, F, G and H) Cerebral EC nuclei in control MO. (I, J, K and L) Cerebral EC nuclei in tnnt2a MO (n = 7–10; two experimental repeats). Comparison of cerebral EC nuclei shows reduced cell numbers in tnnt2a MO with CtAs (filled arrowhead) being particularly affected (d – dorsal, v – ventral; representative images colour-coded by depth). (M, N and O) Voronoi (image partitioning based on nuclei position) diagrams of cerebral EC nuclei suggests nuclei numbers to be maintained in peripheral vessels such as the PHBC (white arrowheads), while EC density is reduced in the midbrain (grey arrowhead) and BA (unfilled arrowhead). |
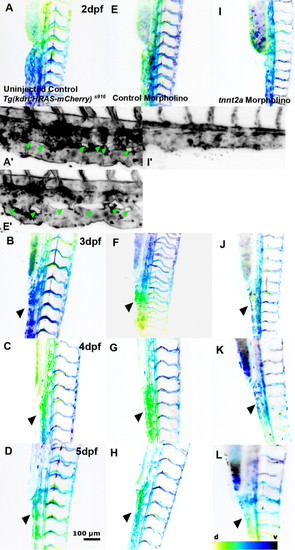
The effect of absent blood flow on trunk vessel development. (A, B, C and D) Trunk vasculature from 2 to 5dpf in Tg(kdrl:HRAS-mCherry)s916 uninjected control. (E, F, G and H) Trunk vasculature in control MO (n = 7–10; two experimental repeats). (I, J, K and L) Trunk vasculature in tnnt2a MO. Topology of the trunk vasculature is established in the absence of flow, but morphology of the CV is severely altered (black arrowheads) and intussusceptions are lacking (green arrowhead; d – dorsal, v – ventral; representative images colour-coded by depth). |

Lack of blood flow impacts trunk EC number. (A, B, C and D) Trunk EC nuclei from 2 to 5dpf in Tg(flk1:nls-eGFP)zf109 uninjected control. (E, F, G and H) Trunk EC nuclei in control MO. (I, J, K and L) Trunk EC nuclei in tnnt2a MO (n = 7–10; two experimental repeats). Visual comparison of trunk EC nuclei suggests comparable numbers between treatment groups (d – dorsal, v – ventral; representative images colour-coded by depth). (M, N and O) Voronoi analysis of trunk EC nuclei shows EC distribution is maintained in the CV (black arrowhead), a decrease is observed in ISVs (red arrowhead), and significant changes are observed more anteriorly (unfilled arrowhead). |
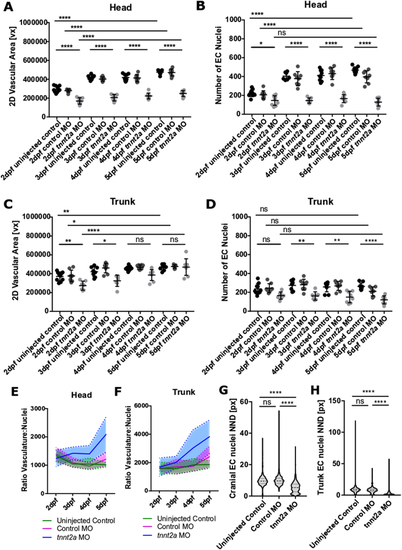
Quantification of vasculature and nuclei. (A) The cerebral vasculature is reduced in tnnt2a MO from 2 to 5dpf (n = 7– 10; two experimental repeats). (B) The number of cerebral EC nuclei is reduced in tnnt2a MO from 2 to 5dpf. (C) The trunk vasculature is reduced in tnnt2a MO at 2–3dpf, but not 4–5dpf (n = 7– 10; two experimental repeats). (D) The number of trunk EC nuclei is not altered in tnnt2a MO at 2dpf, but significantly reduced from 3 to 5dpf. (E) The ratio of cerebral vasculature-to-nuclei remains consistent in uninjected controls (green) and control MO (magenta), but increases over time in tnnt2a MO (blue). (F) The ratio of trunk vasculature-to-nuclei remains consistent in uninjected controls (green) and control MO (magenta), but increases over time in tnnt2a MO (blue). (G) Quantification of cerebral nuclei nearest neighbour distance (NND) showed nuclei distance to be decreased in tnnt2a MO in comparison to uninjected controls (P < 0.0001) and control MO (P < 0.0001; Kruskal–Wallis test). (H) Quantification of trunk nuclei NND showed nuclei distance to be decreased in tnnt2a MO in comparison to uninjected controls (P < 0.0001) and control MO (P < 0.0001; Kruskal–Wallis test). |
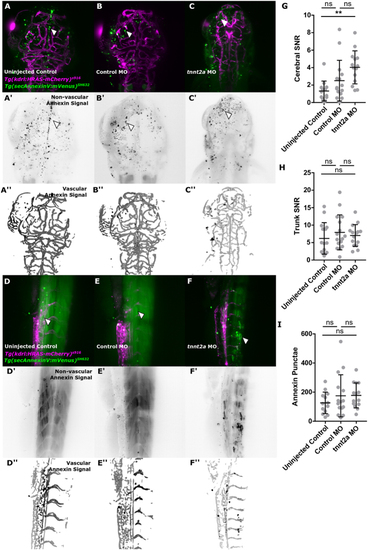
Cell death is increased by absent blood flow. (A, B and C) Cell death, visualized in the transgenic reporter line Tg(secAnnexinV:mVenus)SH632 (n = 13–15; three experimental repeats; 3dpf). (D, E and F) Annexin levels in the trunk vasculature appeared visually similar between groups. (G) Quantification of cerebral annexin SNR showed an increase in tnnt2a MO in comparison to uninjected controls (P = 0.0012) but not control MO (P = 0.072; Kruskal–Wallis test). (H) Quantification of trunk annexin SNR showed no increase in tnnt2a MO in comparison to uninjected controls (P > 0.9999) or control MO (P > 0.9999; Kruskal–Wallis test). (I) Quantification of cerebral annexin foci (white arrowheads) showed no increase in tnnt2a MO in comparison to uninjected controls (P > 0.9999) and control MO (P = 0.4542; Kruskal–Wallis test). |
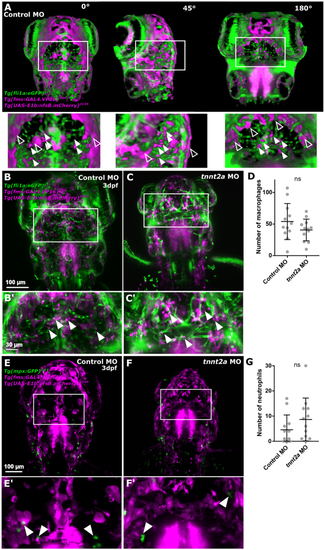
Lack of blood flow does not impact the number of cerebral innate immune cells. (A) Identification of immune cells was performed in 3D, allowing to discern non-specific signal (unfilled arrowhead) from immune cells (filled arrowhead). (B and C) Macrophages (magenta) were quantified examining the transgenic Tg(fli1a:eGFP)y1, Tg(fms:GAL4.VP16)i186, Tg(UAS-E1b:nfsb.mCherry)il149. (D) Number of macrophages was not changed upon blood flow loss (P = 0.2356; n = 12; 3dpf; Mann–Whitney U test). (E and F) Neutrophils (green) were examined in the transgenic reporter line Tg(mpx:GFP)i114, Tg(fms:GAL4.VP16)i186, Tg(UAS-E1b:nfsb.mCherry)il149. (G) Number of neutrophils was not changed upon blood flow loss (P = 0.1708; n = 12; two experimental repeats; 3dpf; Mann–Whitney U test). |

Inflammation is not increased by absent blood flow. (A, B and C) Examining nitric oxide (NO; visualized by DAF-FM) as an inflammatory marker, showed similar levels of NO in the head of uninjected controls, control MO, and tnnt2a MO (uninjected control n = 11, control MO n = 12, tnnt2a MO n = 11; three experimental repeats; 3dpf). (D, E and F) DAF-FM levels in the trunk vasculature appeared visually similar between groups. (G) Quantification of cerebral DAF-FM SNR showed no difference between tnnt2a MO and uninjected controls (P > 0.9999) or control MO (P > 0.9999; Kruskal–Wallis test). (H) Quantification of trunk DAF-FM SNR showed no difference between tnnt2a MO and uninjected controls (P = 0.1391) or control MO (P = 0.1216; Kruskal–Wallis test). |