
|
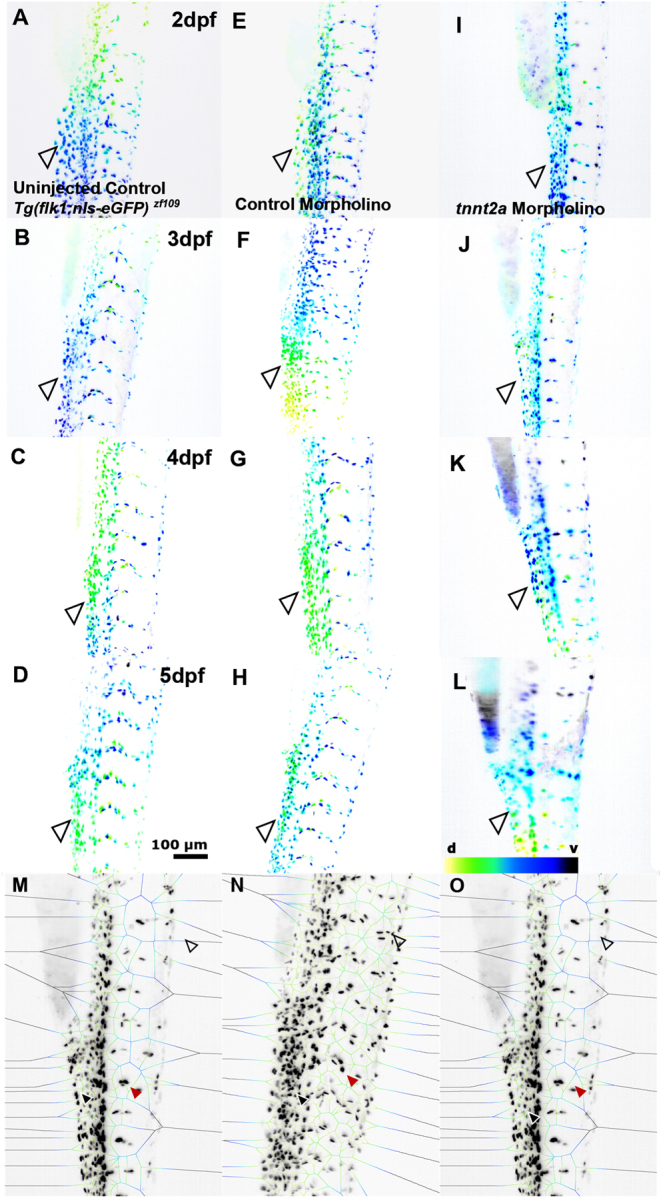
Fig. 4
Lack of blood flow impacts trunk EC number. (A, B, C and D) Trunk EC nuclei from 2 to 5dpf in Tg(flk1:nls-eGFP)zf109 uninjected control. (E, F, G and H) Trunk EC nuclei in control MO. (I, J, K and L) Trunk EC nuclei in tnnt2a MO (n = 7–10; two experimental repeats). Visual comparison of trunk EC nuclei suggests comparable numbers between treatment groups (d – dorsal, v – ventral; representative images colour-coded by depth). (M, N and O) Voronoi analysis of trunk EC nuclei shows EC distribution is maintained in the CV (black arrowhead), a decrease is observed in ISVs (red arrowhead), and significant changes are observed more anteriorly (unfilled arrowhead).