
|
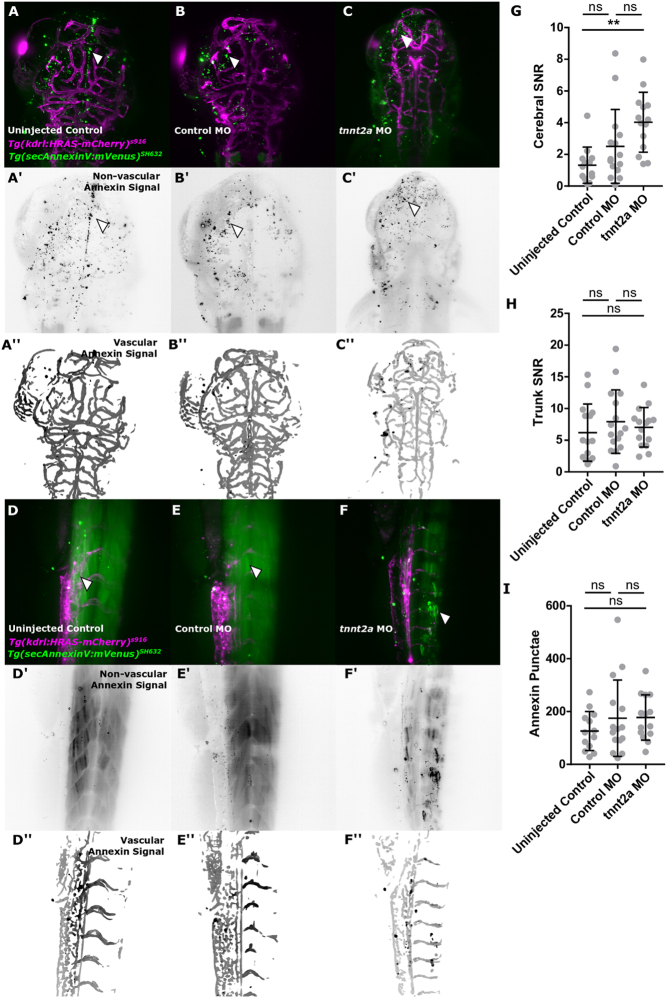
Fig. 6
Cell death is increased by absent blood flow. (A, B and C) Cell death, visualized in the transgenic reporter line Tg(secAnnexinV:mVenus)SH632 (n = 13–15; three experimental repeats; 3dpf). (D, E and F) Annexin levels in the trunk vasculature appeared visually similar between groups. (G) Quantification of cerebral annexin SNR showed an increase in tnnt2a MO in comparison to uninjected controls (P = 0.0012) but not control MO (P = 0.072; Kruskal–Wallis test). (H) Quantification of trunk annexin SNR showed no increase in tnnt2a MO in comparison to uninjected controls (P > 0.9999) or control MO (P > 0.9999; Kruskal–Wallis test). (I) Quantification of cerebral annexin foci (white arrowheads) showed no increase in tnnt2a MO in comparison to uninjected controls (P > 0.9999) and control MO (P = 0.4542; Kruskal–Wallis test).