
Fig. 5
- ID
- ZDB-FIG-221101-23
- Publication
- Kugler et al., 2021 - The effect of absent blood flow on the zebrafish cerebral and trunk vasculature
- Other Figures
- All Figure Page
- Back to All Figure Page
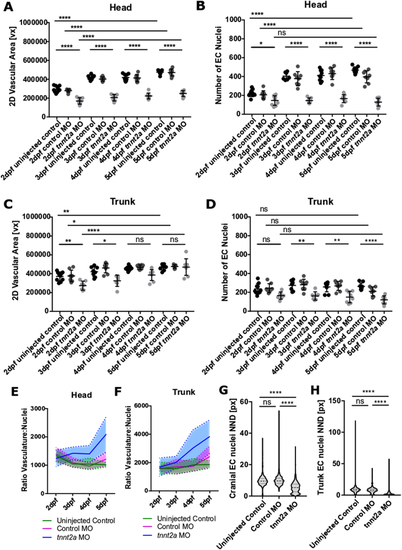
Quantification of vasculature and nuclei. (A) The cerebral vasculature is reduced in tnnt2a MO from 2 to 5dpf (n = 7– 10; two experimental repeats). (B) The number of cerebral EC nuclei is reduced in tnnt2a MO from 2 to 5dpf. (C) The trunk vasculature is reduced in tnnt2a MO at 2–3dpf, but not 4–5dpf (n = 7– 10; two experimental repeats). (D) The number of trunk EC nuclei is not altered in tnnt2a MO at 2dpf, but significantly reduced from 3 to 5dpf. (E) The ratio of cerebral vasculature-to-nuclei remains consistent in uninjected controls (green) and control MO (magenta), but increases over time in tnnt2a MO (blue). (F) The ratio of trunk vasculature-to-nuclei remains consistent in uninjected controls (green) and control MO (magenta), but increases over time in tnnt2a MO (blue). (G) Quantification of cerebral nuclei nearest neighbour distance (NND) showed nuclei distance to be decreased in tnnt2a MO in comparison to uninjected controls (P < 0.0001) and control MO (P < 0.0001; Kruskal–Wallis test). (H) Quantification of trunk nuclei NND showed nuclei distance to be decreased in tnnt2a MO in comparison to uninjected controls (P < 0.0001) and control MO (P < 0.0001; Kruskal–Wallis test). |