
|
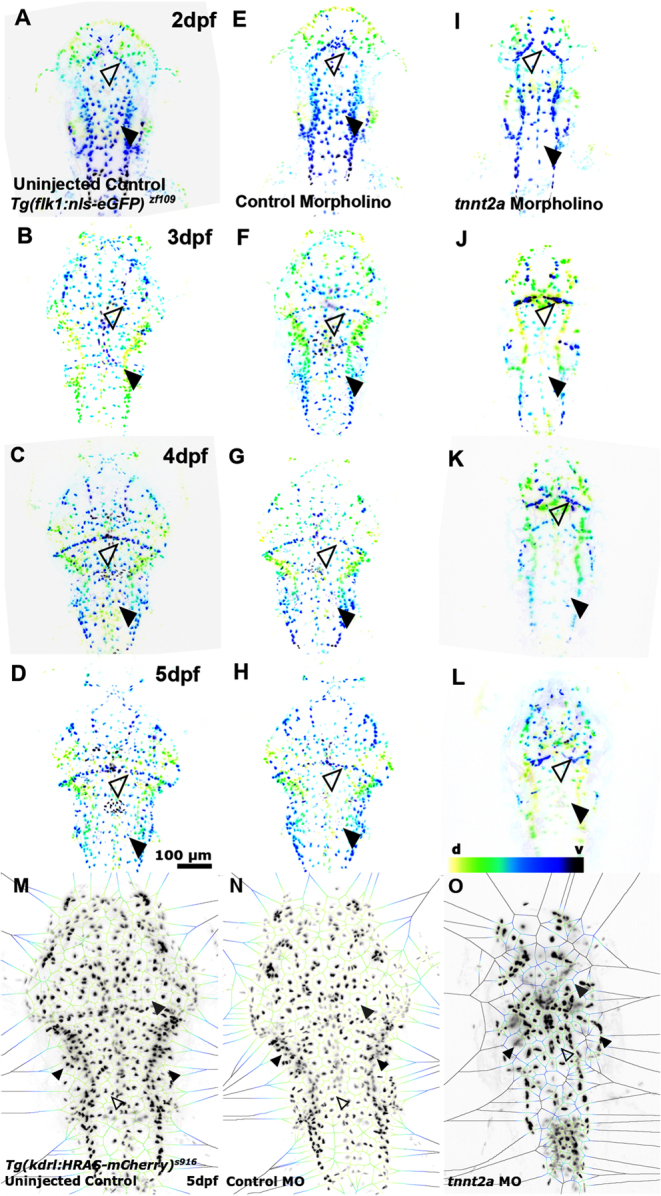
Fig. 2
Lack of blood flow impacts cerebral EC number. (A, B, C and D) Cerebral EC nuclei from 2 to 5dpf in Tg(flk1:nls-eGFP)zf109 uninjected control. (E, F, G and H) Cerebral EC nuclei in control MO. (I, J, K and L) Cerebral EC nuclei in tnnt2a MO (n = 7–10; two experimental repeats). Comparison of cerebral EC nuclei shows reduced cell numbers in tnnt2a MO with CtAs (filled arrowhead) being particularly affected (d – dorsal, v – ventral; representative images colour-coded by depth). (M, N and O) Voronoi (image partitioning based on nuclei position) diagrams of cerebral EC nuclei suggests nuclei numbers to be maintained in peripheral vessels such as the PHBC (white arrowheads), while EC density is reduced in the midbrain (grey arrowhead) and BA (unfilled arrowhead).