
- Title
-
The in vitro and in vivo depigmenting activity of pterostilbene through induction of autophagy in melanocytes and inhibition of UVA-irradiated α-MSH in keratinocytes via Nrf2-mediated antioxidant pathways
- Authors
- Hseu, Y.C., Vudhya Gowrisankar, Y., Wang, L.W., Zhang, Y.Z., Chen, X.Z., Huang, P.J., Yen, H.R., Yang, H.L.
- Source
- Full text @ Redox Biol.
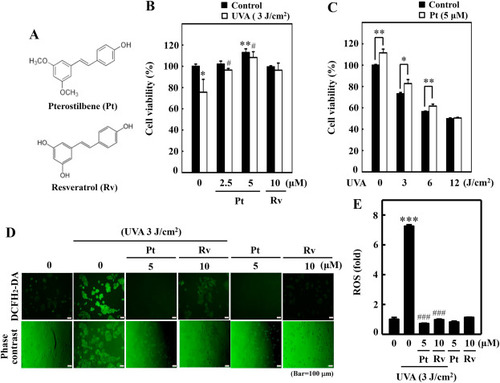
Pterostilbene improved HaCaT cell viability but repressed UVA-induced intracellular ROS production. (A) Chemical structures of Pterostilbene (Pt) and Resveratrol (Rv). (B–C) Cell viability was calculated by the MTT method. HaCaT cells were pre-incubated with Pt (0–5 μM) or Rv (10 μM) for 24 h followed by irradiation with 3 J/cm2 UVA (B). HaCaT cells were treated with or without Pt (5 μM) for 24 h and then irradiated with different UVA intensities (0, 3, 6, or 12 J/cm2) (C). Cells neither treated with Pt or Rv or UVA-irradiated were considered as the untreated control. (D–E) HaCaT cells were pretreated with Pt (5 μM) or Rv (10 μM) for 24 h, followed by irradiated or not with 3 J/cm2 UVA. The intracellular ROS levels were indicated by DCF and measured by fluorescence microscopy (200× magnification) (D). Fluorescence intensity of the DCF-stained cells for each condition was quantified by Olympus Softimage solution software, and data were denoted as fold difference over untreated control values (E). Cells neither treated with Pt or Rv or UVA-irradiated were considered as the untreated control. Results were denoted as mean ± SD of three or more independent experiments. Statistical significance was considered as *p < 0.05, **p < 0.01 and ***p < 0.001 compared to untreated control. #p < 0.05 and ###p < 0.001 compared to UVA-irradiated cells. |

Pt suppressed UVA-induced α-MSH expression in HaCaT cells and other melanogenic proteins in B16F10 cells. (A) HaCaT cells were first treated with Pt (0–5 μM) or Rv (10 μM) for 24 h and then irradiated or not with 3 J/cm2 UVA. After 8 h, cells were collected, proteins were extracted. The Western blot method to determine POMC and α-MSH protein levels. (B–D) The conditioned medium obtained from Pt pretreated (2.5 or 5 μM, 24 h) and 3 J/cm2 UVA-irradiated HaCaT cells were tested on B16F10 cells for the indicated time points. The Western blot method determined the expression of CREB, p-CREB (2 h) (B), MITF (4 h) (C) or tyrosinase (24 h) proteins (D). β-actin or histone proteins were used as loading control proteins. AlphaEaseFC™ software was used to measure the immunoreactive protein bands (Genetic Technologies, Inc. Florida, USA). (E) Pt inhibited melanin formation in α-MSH-stimulated B16F10 cells – different concentrations of Pt (0–30 μM, 24 h) were first treated to B16F10 cells, and then stimulated or not with α-MSH (1 μM, 24 h). Melanin was quantified as described in the methodology. Results were denoted as mean ± SD of three or more independent experiments. Statistical significance was considered as ***p < 0.001 compared to untreated control and ###p < 0.001 compared to α-MSH-stimulated cells. |

Pt suppressed various melanogenesis-related proteins in B16F10 cells stimulated with α-MSH. (A) B16F10 cells were first treated with Pt (0–30 μM) followed by stimulation or not with α-MSH (1 μM) to determine the expression pattern of different melanogenesis-associated proteins - MC1R (15 min) (A) p-MITF (4 h), MITF (4 h) (B–C), and tyrosinase (24 h), TRP-1 (24 h), and TRP-2 (24 h) (D–E). After incubation, cells were harvested, and protein lysates were put through the Western blot analysis. β-actin functioned as a loading control protein. Results were denoted as mean ± SD of three or more independent experiments. Data were denoted as fold-difference over untreated control. Statistical significance was considered as *p < 0.05, ***p < 0.001 compared to untreated control. #p < 0.05 compared to α-MSH-stimulated cells. |

Pt induced autophagy in HaCaT cells. Diverse concentrations of Pt (0–5 μM, 24 h) were treated to HaCaT cells - (A) The change of LC3-I to LC3-II and p62 protein expressions were measured through the Western blot method. Data were expressed as fold differences over untreated control cells. The β-actin protein functioned as a loading control. (B–C) Pt increased AVO formation – 3-MA (1 mM, 1 h) pretreated HaCaT cells were incubated with Pt (5 μM, 24 h). A fluorescence microscope (under red filter) was used to visualize the intracellular AVOs (Bar = 50 μm). AVO number is proportional to the intensity of red fluorescence. Values were quantified using Olympus Softimage Solution software. Data were denoted as fold differences over control (untreated) cells. (D) Pt decreased gp100 levels – B16F10 cells were stimulated with α-MSH (1 μM, 72 h). After incubation, the medium was separated and centrifuged at 1200 rpm for 5 min to collect the supernatant (containing melanin). 2 mL of this supernatant was treated to HaCaT cells (grown in 60 mm dish) and incubated for 72 h. Later, HaCaT cells were treated with Pt (2.5 or 5 μM, 24 h). The Western blot technique measured the LC3-II and melanoma gp100 proteins expression. β-actin functioned as an internal control protein. LC3-II data were denoted as percentage difference over untreated control. Melanoma gp100 protein data were denoted as fold-difference over untreated control. All results were denoted as mean ± SD of three or more independent experiments. Statistical significance was considered as *p < 0.05, **p < 0.01, ***p < 0.001 compared to untreated control cells. #p < 0.05, ##p < 0.01 compared to melanin alone or Pt alone treated cells. |

Pt accumulated nuclear Nrf2 levels leading to HO-1, γ-GCLC expressions in HaCaT cells. 5 μM Pt was treated to the cells. (A) The immunofluorescence method was used to examine (magnification × 200) the nuclear localization of Nrf2 protein. (B–C) The Western blot method determined the expression of nuclear Nrf2 (0–4 h) (B) or HO-1 and γ-GCLC proteins (0–8 h) (C). (D–E) Cells were first treated with Pt (0–5 μM for 24 or 0.5 h), followed by 3 J/cm2 UVA-irradiation or not for the indicated time. The Western blot method determined the expressions of Nrf2, Keap-1, p-Nrf2 proteins (D). The Nrf2/Keap-1 ratio data were denoted as the fold-difference over untreated control (E). β-actin functioned as a loading control protein. Results were denoted as mean ± SD of three or more independent experiments. Statistical significance was considered as **p < 0.01, ***p < 0.001 compared to untreated control and #p < 0.05, ###p < 0.001 compared to UVA-irradiated cells. |

Various signaling pathways mediate the activation of nuclear Nrf2 in Pt-treated HaCaT cells. (A) Cells were first treated with 20 μM SB203580 (p38 inhibitor), 30 μM PD98059 (ERK inhibitor), 25 μM SP600125 (JNK inhibitor), 30 μM LY294002 (PI3K/AKT inhibitor), 2.5 μM GF109203X (PKC inhibitor), 10 μM Compound C (AMPK inhibitor), 20 μM CKII, (Casein kinase II inhibitor), or 1 mM NAC (ROS inhibitor) for 30 min. Later, Pt was treated to the cells (5 μM, 30 min). After incubation, cells were harvested, and nuclear Nrf2 protein expression was measured through the Western blot method. The histone protein functioned as the loading control. (B) Cells were tested with 5 μM Pt for 0–120 min. p-ERK, ERK, and p-AMPK proteins were measured by the Western blot method. β-actin functioned as an internal control protein. (C–D) Cells were treated with Pt (5 μM, 0–60 min) and the intracellular ROS were indicated by DCF, which were measured by fluorescence microscopy (200× magnification). Fluorescence intensity of the DCF-stained cells for each condition was quantified by Olympus Softimage solution software, and data were denoted as ROS-fold difference over untreated control values versus different time points (D). Results were denoted as mean ± SD of three or more independent experiments. Statistical significance was considered as ***p < 0.001 compared to untreated control and ###p < 0.001 compared to cells treated with 5 μM Pt for at 30 min time point. |

Silencing of Nrf2 suppressed Pt-mediated protective effects in HaCaT cells. (A) Cells transfected with specific siRNA for Nrf2 or nonsilencing control were tested with Pt (5 μM) for the indicated time. The Western blot method measured the expression of total Nrf2 (0.5 h), HO-1 (6 h), NQO-1 (8 h), and γ-GCLC (8 h) proteins. (B) Transfected cells were first treated with Pt (5 μM, 24 h) and then exposed or non-exposed to 3 J/cm2 UVA. DCF fluorescence technique was used to measure the ROS levels. (C) Transfected cells were first treated with Pt (30 μM, 24 h) followed by exposure or non-exposed to 3 J/cm2 UVA to determine α-MSH protein levels through the Western blot method. Results were denoted as mean ± SD of three or more independent experiments. Statistical significance was considered as *p < 0.05, ***p < 0.001 compared to UVA-irradiated transfected cells. |
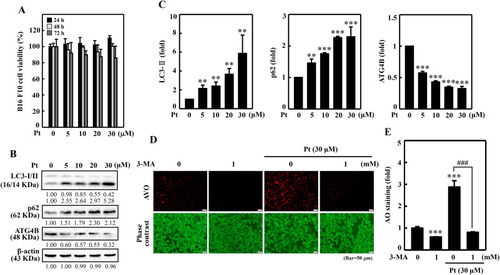
Pt induced autophagy flux in B16F10 cells. Different concentrations of Pt (0–30 μM, 24, 48, 72 h) were treated to B16F10 cells - (A) MTT assay determined the cell viability. (B–C) The Western blot technique determined the conversion of LC3-I to LC3-II and p62 and ATG4B proteins. The β-actin functioned as a loading control. (D–E) Pt increased AVO formation – B16F10 cells were first treated with 3-MA (1 mM, 1 h) and then with Pt (30 μM, 24 h). A fluorescence microscope (under red filter) was used to visualize the intracellular AVOs (Bar = 50 μm). AVO number is proportional to the intensity of red fluorescence. Values were quantified using Olympus Softimage Solution software. Data were denoted as fold differences over untreated control cells. Results were denoted as mean ± SD of three or more independent experiments. Statistical significance was considered as **p < 0.01, ***p < 0.001 compared to untreated control cells. ###p < 0.001 compared to Pt-alone treated cells. |
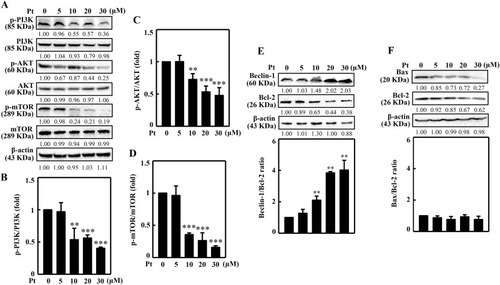
Pt suppressed PI3K/AKT/mTOR pathway and dysregulated the Beclin-1/Bcl-2 and Bax/Bcl-2 ratios in B16F10 cells. Inhibitory effects of Pt in B16F10 cells. Different concentrations of Pt (0–30 μM, 8 or 24 h) were treated to the cells. The Western blot technique determined the p-PI3K, PI3K (8 h), p-AKT, AKT (8 h), p-mTOR, mTOR (8 h) (A–D) or Beclin-1, Bcl-2, Bax (24 h) (E–F) proteins. Data were denoted as fold differences between phosphorylated and non-phosphorylated forms of PI3K (B), AKT (C), or mTOR (D) proteins. In Beclin-1, Bcl-2, Bax proteins, data were denoted as fold ratio between Beclin/Bcl-2 (E) or Bax/Bcl-2 (F). The β-actin functioned as a loading control. Results were denoted as mean ± SD of three or more independent experiments. Statistical significance was considered as **p < 0.01, ***p < 0.001 compared to untreated control cells. |

3-MA negatively affected the anti-melanogenic activity of Pt in B16F10 cells. (A–B) Cells were first treated or not with 3-MA (1 mM, 1 h) followed by Pt (0–30 μM) for 24 h (A) or 72 h (B). After treatments, an MTT assay was performed to determine the cell viability. (C–E) Cells were first treated or not with 3-MA (1 mM, 1 h), followed by 30 μM Pt treatment for different time points to allow the expression of various melanogenesis-associated proteins - p-CREB (2 h), CREB (2 h) (C), p-MITF (4 h), MITF (4 h) (D), tyrosinase (24 h), TRP-1 (24 h), TRP-2 (24 h) (E) through the Western blot method. β-actin functioned as a loading control. (F) Cells were treated with Pt (30 μM) in the absence or presence of 3-MA (1 mM, 1 h) followed by stimulation with α‐MSH (1 μM, 24 h). The melanosome-engulfing autophagosomes in the cells were analyzed through transmission electron microscopy (Tecnai 12, FEI, Hillsboro, Oregon USA) (Bar = 1 μm). The black arrows indicate autophagosome containing melanin or melanosome. (G) Cells were first treated or not with 3-MA (1 mM, 1 h), and then with Pt (30 μM, 72 h) followed by stimulation with α‐MSH (1 μM, 24 h). Cells were harvested, and intracellular melanin levels were estimated as described in the methodology. Cells treated with 30 μM Pt alone or α‐MSH alone or 3-MA alone functioned as controls. Results were denoted as mean ± SD of three or more independent experiments. Statistical significance was considered as ***p < 0.001 compared to untreated control cells or α‐MSH-stimulated cells. ##p < 0.01 compared to α‐MSH + Pt treated cells. |
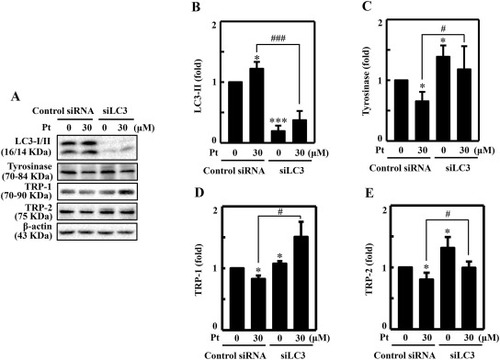
LC3 knockdown diminished Pt-mediated anti-melanogenic proteins expression in B16F10 cells. Transfection experiment was conducted as described in the methodology. The LC3 expression was silenced using a specific siRNA against LC3. Non-silenced cells functioned as control. (A–E) Transfected cells were treated with 30 μM Pt for the indicated time points to allow the expression of LC3 (24 h) (B), tyrosinase (24 h) (C), TRP-1 (24 h) (D), and TRP-2 (24 h) (E) proteins in both non-silenced (control siRNA) and siLC3 cells. After incubation, cells were harvested, and cell lysate was subjected to the Western blot technique. The β-actin protein functioned as a loading control. Results were denoted as mean ± SD of three or more independent experiments. Statistical significance was considered as *p < 0.05 ***p < 0.001 compared to control siRNA cells and #p < 0.05, ###p < 0.001 compared to Pt-treated control siRNA cells. |

Anti-melanogenic effects of Pt on Zebrafish embryos. A stereomicroscope was used to observe the changes in endogenous body pigmentation in the zebrafish embryos (lateral views were denoted in the figures). (A) Vehicle (0.1% DMSO) or Pt (2.5 and 5 μM) or Rv (10 μM) were treated to 24 hpf zebrafish embryos and incubated for 48 or 72 hpf embryos. (B) 72 hpf embryos pre-incubated without or with 3-MA (1 mM) were further incubated in the presence of Pt (5 μM) for 24 h (72 + 24 hpf). 1-phenyl-2-thiourea (PTU, 8.8 μM) functioned as a positive control. Results were calculated from three or more independent experiments. |
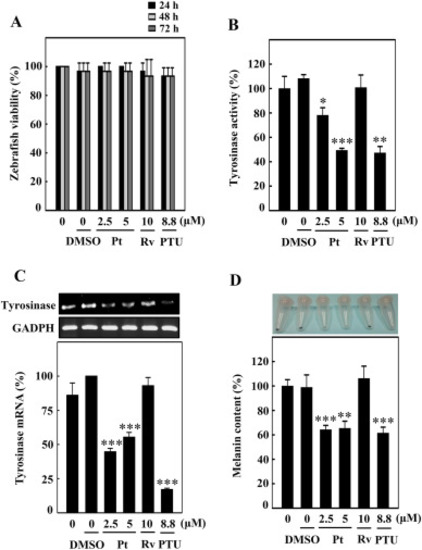
Pt downregulated the tyrosinase expression and melanin levels in zebrafish. Zebrafish embryos (24 hpf) were incubated with vehicle (0.1% DMSO) or Pt (2.5 and 5 μM) or Rv (10 μM) for 72 hpf. (A) The zebrafish viability was counted under the stereomicroscope. (B) The tyrosinase enzyme activity under different treatment conditions was measured as described in the Methodology Section. (C) Tyrosinase gene expression was measured using the RT-PCR technique. GAPDH functioned as an internal control gene (D) Melanin production induced under different treatment conditions was quantified from zebrafish lysates as explained in the Methodology Section. 1-phenyl-2-thiourea (PTU, 8.8 μM) functioned as a positive control. Results were denoted as mean ± SD of three or more independent experiments. Data were denoted as percentage differences over untreated control zebrafish embryos. Statistical significance was considered as *p < 0.05, **p < 0.01, ***p < 0.001 compared to untreated zebrafish embryos. |
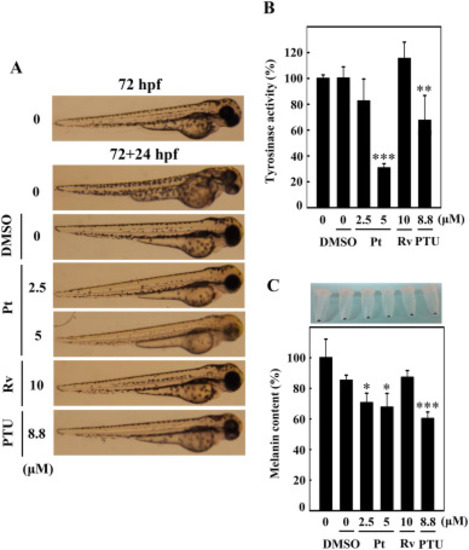
Pt suppresses melanogenesis in 72 hpf zebrafish embryos. 72 hpf zebrafish embryos were incubated with vehicle (0.1% DMSO) or Pt (2.5 and 5 μM) or Rv (10 μM) for 24 h (72 + 24 hpf). 1-phenyl-2-thiourea (PTU, 8.8 μM) functioned as a positive control. A stereomicroscope was used to measure the endogenous body pigmentation (A). The method for estimating tyrosinase enzyme activity. (B) and melanin contents (C) was explained in the methodology. Results were calculated from three or more independent experiments. Data were denoted as percentage differences over untreated control zebrafish embryos. Statistical significance was considered as *p < 0.05, **p < 0.01, ***p < 0.001 compared to untreated zebrafish embryos. |