
|
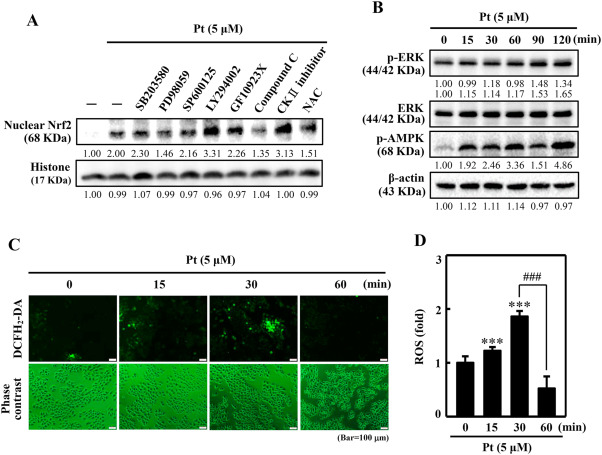
Fig. 6 Various signaling pathways mediate the activation of nuclear Nrf2 in Pt-treated HaCaT cells. (A) Cells were first treated with 20 μM SB203580 (p38 inhibitor), 30 μM PD98059 (ERK inhibitor), 25 μM SP600125 (JNK inhibitor), 30 μM LY294002 (PI3K/AKT inhibitor), 2.5 μM GF109203X (PKC inhibitor), 10 μM Compound C (AMPK inhibitor), 20 μM CKII, (Casein kinase II inhibitor), or 1 mM NAC (ROS inhibitor) for 30 min. Later, Pt was treated to the cells (5 μM, 30 min). After incubation, cells were harvested, and nuclear Nrf2 protein expression was measured through the Western blot method. The histone protein functioned as the loading control. (B) Cells were tested with 5 μM Pt for 0–120 min. p-ERK, ERK, and p-AMPK proteins were measured by the Western blot method. β-actin functioned as an internal control protein. (C–D) Cells were treated with Pt (5 μM, 0–60 min) and the intracellular ROS were indicated by DCF, which were measured by fluorescence microscopy (200× magnification). Fluorescence intensity of the DCF-stained cells for each condition was quantified by Olympus Softimage solution software, and data were denoted as ROS-fold difference over untreated control values versus different time points (D). Results were denoted as mean ± SD of three or more independent experiments. Statistical significance was considered as ***p < 0.001 compared to untreated control and ###p < 0.001 compared to cells treated with 5 μM Pt for at 30 min time point.