FIGURE SUMMARY
Title

Variation in phenotypes from a Bmp-Gata3 genetic pathway is modulated by Shh signaling

Authors
Swartz, M.E., Lovely, C.B., Eberhart, J.K.
Source
Full text @ PLoS Genet.

A null allele of <italic toggle='yes'>gata3</italic> generated via CRISPR-Cas9.

(A) As previously reported gata3b1075 mutation is located in exon 4. The CRISPR gata3 mutant allele au42 disrupts the second exon. (B) The gata3 au42 allele is a two base pair insertion/25 base pair deletion. (C) Predicted wild type and gata3au42 mutant protein sequences indicates a frame shift followed by four consecutive stops in translation.

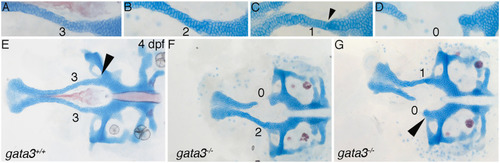
(A-G) Flat mounts of 4 dpf neurocrania, anterior to the left showing magnified images of trabeculae. Phenotypes were scored on individual sides of the neurocranium according to the level of disruption to the trabeculae. (A) Wild type phenotype (score = 3) with trabeculae fused and in one plane with the posterior neurocranium. The cells within the trabeculae are arranged into a column resembling a stack of coins. (B) Disruption to the columnar arrangement of trabeculae cells (score = 2) with proper fusion to the posterior neurocranium with all cells in one plane. (C) Trabeculae cells not stacked properly and fused inappropriately, below the plane of the posterior neurocranium, see arrowhead (score = 1). (D) Loss of trabeculae cells (score = 0) and therefore no fusion to the posterior neurocranium. (E-G) 4 dpf flat mounted neurocrania, anterior to the left showing examples of trabeculae scoring. (E) Wild type zebrafish with arrowhead indicating proper lateral commissure fusion. (F-G) gata3 mutant embryos, arrowhead in G indicating improper lateral commissure fusion. In subsequent figures the numbering above the trabeculae reflect trabeculae scoring.

Dynamic expression of <italic toggle='yes'>gata3</italic> in maxillary neural crest cells.

(A-D) Lateral views, anterior to the left, of gata3 in situ hybridization. (A) At 22 hpf, gata3 is expressed in the head in brain (black arrow), ear (e) and what is likely to be endoderm (*). (B) By 24 hpf, gata3 expression domains include cranial neural crest cells, which contain the trabeculae precursors (white arrowheads), the brain and neurons. (C) At 26 hpf expression continues in all previously expressing tissues. The white arrowheads indicate the cranial neural crest cells that give rise to trabeculae. (D) At 48 hpf expression begins to be down regulated in the developing palate. (E-G) RNA Scope V2 whole mount in situ hybridization at 36 hpf; white arrowheads bracket the trabeculae precursors. (E) Expression of pdgfra in cranial neural crest cells. (F) Expression of gata3 in maxillary cranial neural crest cells that will give rise to trabeculae. (G) The overlap of of pdgfra and gata3 in trabeculae precursors.

Gata3 function is required during early palatogenesis.

(A) Embryo carrying the hsp:GATA3-EGFP transgene heat shocked at 48–49 hpf and imaged at 52 hpf expressing human GATA3 in every cell. (B) Flat mount of a cartilage stained 4 dpf hsp:GATA3-EGFP;gata3+/+ embryo that was heat shocked at 24 hpf with no resulting visible malformations. (C) Flat mount of a cartilage stained 4 dpf neurocranium carrying hsp:GATA3-EGFP;gata3au42/au42. The mutant embryo was heat shocked at 24 hpf and resulted in a substantial rescue of the trabeculae phenotype. (D) Graph depicting quantification of mutant gata3au42 phenotype scores at different heat shock time points. Trabeculae phenotype is rescued significantly by hsp:GATA3-EGFP at 24–26 hpf and also at 30 hpf. A one-way ANOVA was performed followed by Dunnett’s multiple comparisons test, gata3au42/au42 control was compared to all other conditions.

PHENOTYPE:
Fish:
Condition:
Observed In:
Stage: Day 4

Chimeric analyses demonstrate that cranial neural crest require <italic toggle='yes'>gata3</italic>.

(A-C) Wild type sox10:mCherry CNCC (in red) were transplanted unilaterally into gata3;fli1:EGFP mutant hosts (in green). The resulting embryo was imaged at 30 hpf showing the major contribution to the maxillary is wild type (arrow). (D) Flat mount of 4dpf neurocrania of the same fish showing the rescue of the trabeculae (arrow) compared to the loss of trabeculae on the non-transplanted side of the embryo. (E) Graph depicting the overall trabeculae score of the 10 chimeric embryos with the transplanted sides phenotype significantly improved relative to the non-transplanted sides (Mann-Whitney test P = 0.0052). (F) Wild type ubi:Switch (in green) were transplanted unilaterally into gata3 LOF;sox10:mCherry. Chimeric embryos (n = 4) were imaged at 30 hpf to demonstrate donor cells populating the majority of the maxillary domain. (G) Flat mount of same fish at 4 dpf showing that the green donor cells populate the trabeculae on the transplanted side. (H) Stained flat mount of same embryo at 4 dpf showing complete rescue of the trabeculae phenotype. Compare the transplanted trabeculae to the disorganized and improperly fused trabeculae on the control side.

Bmp signaling to maxillary neural crest regulates the expression of <italic toggle='yes'>gata3</italic>.

(A-D) Lateral views with anterior to the left of 36 hpf gata3 in situ hybridization black arrows point to maxillary crest that will give rise to trabeculae; white arrows mark the ear. (A-B) Embryos from a smad5 clutch. (A) Wild type embryo showing strong expression of gata3 in maxillary trabeculae precursors. (B) Mutant embryo showing loss of gata3 expression in trabeculae precursors. (C-D) Embryos from a hsp:DN-Bmpr1a clutch. (C) No heat shock embryo arrowhead indicates gata3 expression in maxillary precursors. (D) Embryo heat shocked at 24 hpf arrowhead indicates loss of gata3 expression in maxillary CNCC. (E-G) Confocal images of Bmp responsive cells (green, cytoplasmic) and CNCC (red, membrane tagged), lateral views with anterior to the left at 24 hpf. Arrow points to Bmp responsive maxillary neural crest cells.

Gata3 functions downstream of Bmp in palate development.

(A-C) Flat mounts of 4 dpf neurocrania anterior to the left. (A) Wild type phenotype of the hsp:DN-BmpR1a with no heat shock. (B) Severely affected trabeculae typical of the hsp:DN-BmpR1a when heat shocked at 24 hpf. (C) A typical rescue of the hsp:DN-BmpR1a;hsp:GATA3-EGFP heat shock phenotype at 24 hpf. (D) Graph depicting quantification of heat shock phenotype scores at three different heat shock time points. Trabeculae phenotype is rescued significantly by hsp:GATA3-EGFP at 24 and 26 hpf. Phenotypes are also rescued at 28 hpf, but to a lesser degree as the overall phenotype is not as severe. A two way ANOVA was performed with Holm-Sidak’s multiple comparisons test. At all heat shock timepoints the hsp:DN-BmpR1a controls had significantly worse phenotype when compared to the hsp:DN-BmpR1a;hsp:GATA3-EGFP double heat shock.

Shh signaling can modulate the trabeculae phenotype in <italic toggle='yes'>gata3</italic> mutants.

(A-B) Flat mounts of 5dpf gata3b1075 /b1075 “severe” background neurocrania anterior to the left. (A) Phenotype of “severe” gata3-/- with characteristic severely affected trabeculae. (B) Representative image of a gata3-/- “severe” embryo treated with the Hh agonist SAG, showing the partial rescue of the trabeculae. (C) Graph depicting trabeculae defect scores for untreated and SAG-treated gata3-/-. The trabeculae phenotype was significantly improved in the SAG-treated embryos compared to controls via t-test (p = 0.0022). Control embryos x = 0.3125, SEM = 0.1197, n = 16; SAG treated embryos x = 0.7879, SEM = 0.08436, n = 33). (D-F) Flat mounts of 5dpf gata3b1075 /b1075 “mild” background neurocrania anterior to the left. (D) Phenotype of “mild” gata3-/- showing mildly affected trabeculae. (E) Typical image of a gata3-/- “mild” embryo treated with the Shh antagonist cyclopamine displaying a much more severe phenotype. (F) Graph depicting trabeculae defect scores for untreated and cyclopamine-treated gata3-/-. Trabeculae phenotype was significantly exacerbated in the cyclopamine-treated embryos compared to controls as determined by t-test p = 0.0174, Control x = 1.269, SEM = 0.1184 n = 26; cyclopamine-treated embryos x = 0.88, SEM = 0.0975, n = 50).

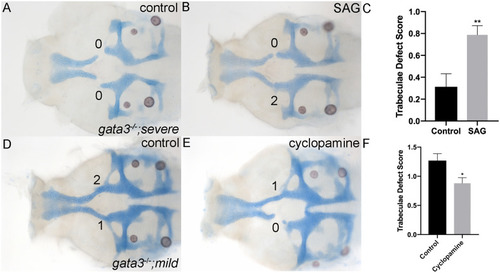
(A-D) Flat mounts of 5dpf gata3 b1075/b1075 neurocrania anterior to the left. (A-B) control untreated-embryos from the gata3 “severe” background showing normal stacking and fusion of trabeculae. Both of (A) wild type and (B) heterozygotes develop normally. (C-D) Cyclopamine-treated embryos. (C) Wild type embryo showing normal stacking and fusion of trabeculae (n = 22/22). (D) Heterozygote embryo displaying complete loss of trabeculae with severe clefts (n = 6/61).

(A) Lateral view of 36 hpf embryo, blue box indicates region of interest in the maxillary trabeculae precursors. (B) Confocal z slice of region of interest in (A). Red dots are labeled ptch2 transcripts. (C) Quantification for each group. Mild mutants have significantly elevated levels of ptch2 relative to the severe mutants (p = 0.0085) and the mild wild types (p = 0.0183). Mild wild type x = 13.11, S.E. = 1.506, n = 18; mild mutant x = 20.87, S.E. = 2.360, n = 15; severe wild type x = 14.40, S.E. = 1.904, n = 15; severe mutant x = 11.50, S.E. = 1.640, n = 12.

Acknowledgments
This image is the copyrighted work of the attributed author or publisher, and ZFIN has permission only to display this image to its users. Additional permissions should be obtained from the applicable author or publisher of the image. Full text @ PLoS Genet.