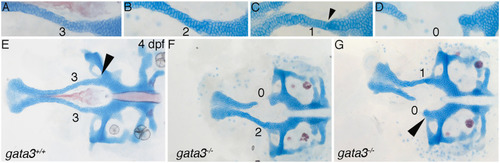
(A-G) Flat mounts of 4 dpf neurocrania, anterior to the left showing magnified images of trabeculae. Phenotypes were scored on individual sides of the neurocranium according to the level of disruption to the trabeculae. (A) Wild type phenotype (score = 3) with trabeculae fused and in one plane with the posterior neurocranium. The cells within the trabeculae are arranged into a column resembling a stack of coins. (B) Disruption to the columnar arrangement of trabeculae cells (score = 2) with proper fusion to the posterior neurocranium with all cells in one plane. (C) Trabeculae cells not stacked properly and fused inappropriately, below the plane of the posterior neurocranium, see arrowhead (score = 1). (D) Loss of trabeculae cells (score = 0) and therefore no fusion to the posterior neurocranium. (E-G) 4 dpf flat mounted neurocrania, anterior to the left showing examples of trabeculae scoring. (E) Wild type zebrafish with arrowhead indicating proper lateral commissure fusion. (F-G) gata3 mutant embryos, arrowhead in G indicating improper lateral commissure fusion. In subsequent figures the numbering above the trabeculae reflect trabeculae scoring.
|
