|
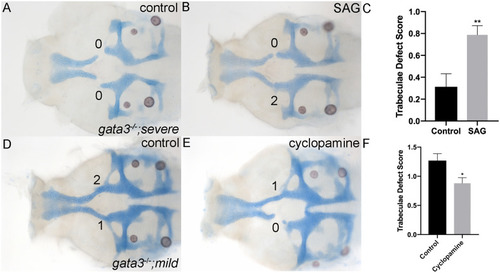
Shh signaling can modulate the trabeculae phenotype in <italic toggle='yes'>gata3</italic> mutants.(A-B) Flat mounts of 5dpf gata3b1075 /b1075 “severe” background neurocrania anterior to the left. (A) Phenotype of “severe” gata3-/- with characteristic severely affected trabeculae. (B) Representative image of a gata3-/- “severe” embryo treated with the Hh agonist SAG, showing the partial rescue of the trabeculae. (C) Graph depicting trabeculae defect scores for untreated and SAG-treated gata3-/-. The trabeculae phenotype was significantly improved in the SAG-treated embryos compared to controls via t-test (p = 0.0022). Control embryos x = 0.3125, SEM = 0.1197, n = 16; SAG treated embryos x = 0.7879, SEM = 0.08436, n = 33). (D-F) Flat mounts of 5dpf gata3b1075 /b1075 “mild” background neurocrania anterior to the left. (D) Phenotype of “mild” gata3-/- showing mildly affected trabeculae. (E) Typical image of a gata3-/- “mild” embryo treated with the Shh antagonist cyclopamine displaying a much more severe phenotype. (F) Graph depicting trabeculae defect scores for untreated and cyclopamine-treated gata3-/-. Trabeculae phenotype was significantly exacerbated in the cyclopamine-treated embryos compared to controls as determined by t-test p = 0.0174, Control x = 1.269, SEM = 0.1184 n = 26; cyclopamine-treated embryos x = 0.88, SEM = 0.0975, n = 50).
|