
- Title
-
Deleterious Effects of Overfeeding on Brain Homeostasis and Plasticity in Adult Zebrafish
- Authors
- Ghaddar, B., Bringart, M., Lefebvre d'Hellencourt, C., Meilhac, O., Diotel, N.
- Source
- Full text @ Zebrafish

DIO results in increased body weight, length, and BMI in both male and female zebrafish. (A) Zebrafish pictures highlighting the morphological differences at week 4 in male. (B, C) Graphs illustrating the body weight measurements during 4 weeks for both CTRL and DIO-treated zebrafish in male and female, respectively. (D, E) Body weight at week 4 in male and female, respectively. (F, G) Body length at week 4 in male and female zebrafish, respectively. (H, I) BMI (g/cm2) calculated at week 4. n = 8–10 for males and n = 3–4 for females. Error bars correspond to SEM. Two-way ANOVA (B, C) and Student's t-test (D–I) *p < 0.05; **p < 0.01; ****p < 0.0001. Scale bar: 7 mm. ANOVA, analysis of variance; BMI, body mass index; CTRL, control; DIO, diet-induced obesity/overweight; SEM, standard error of the mean. PHENOTYPE:
|
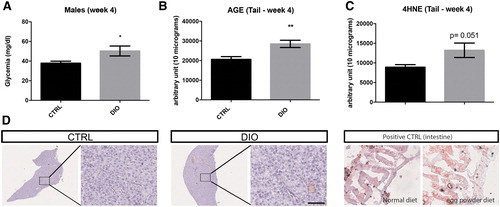
DIO effects on hyperglycemia, AGE levels, 4-HNE levels, and liver steatosis. (A) Fasting blood glucose measurements at week 4 in CTRL and DIO-treated fish (n = 10–12). (B, C) Graphs showing dot-blot quantification of AGE and 4-HNE levels in the tail of CTRL and DIO fish at week 4 (n = 6). (D) Cryostat liver sections stained with Oil Red O in control fish showing no lipid accumulation, and consequently no liver steatosis in CTRL and DIO conditions at week 4 (n = 3). A positive control shows a stronger Oil Red O staining in the intestine of fish overfed 1 week with egg yolk from chicken compared with a fish receiving a normal diet. Bar graph: SEM. Student's t-test: *p < 0.05. **p < 0.01. Error bars correspond to SEM. Scale bar: 250 μm for lower magnification pictures, 50 μm for higher magnification ones. 4-HNE, 4-hydroxynonenal; AGE, advanced glycation end product; n, number of fish. Color images are available online. PHENOTYPE:
|
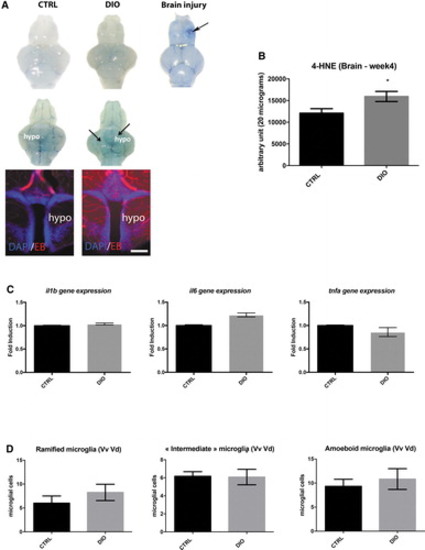
DIO impact on BBB leakage, cerebral oxidative stress, and neuroinflammation. (A) First row: dorsal view pictures of the brain from DIO model CTRL and DIO fish. Second row: ventral view pictures of the brain from DIO model CTRL and DIO fish (n = 3–6 brains). Note the barely blue stained brain parenchyma of DIO-treated fish. Third column: positive control showing Evans blue extravasation in the injured telencephalon (arrows). In (A), hypothalamic vibratome section showing Evans blue staining (Red) extravasation in the parenchyma. (B) Graph showing dot-blot quantification of 4-HNE staining in the brains of CTRL and DIO fish (n = 4). (C) Proinflammatory cytokines (il1β, il6, and tnfα) cerebral gene expression in CTRL and DIO conditions (n = 3 pools of 2 brains). (D) Counting of ramified, “intermediate,” and ameboid microglia in the ventral part of the telencephalon (Vv Vd region) in both CTRL and DIO fish (n = 6). Bar graph: SEM. Student's t-test: *p < 0.05. Scale bar: 1 mm for whole brain picture and 75 μm for hypothalamic sections. BBB, blood–brain barrier; n, number of fish; Vd, dorsal nucleus of ventral telencephalic area; Vv, ventral nucleus of ventral telencephalic area. Color images are available online. |

DIO impairs neurogenesis in the forebrain of adult zebrafish. (A–F) Statistical analysis of the number of PCNA-positive cells in CTRL and DIO zebrafish. A significant decrease in proliferative activity was observed between CTRL and DIO group in the Vv-Vd and in the telencephalic region (Dm + Vv-Vd). Only a decreasing trend was observed in the Dm, PPa, PPv, and in the region surrounding the LR PR regions (n = 6). n = number of brains studied. Bar graph: SEM. Student's t-test: *p < 0.05; **p < 0.01. Scale bar = 32 μm. The brain schemes correspond to the transversal sections of the zebrafish brain for the region studied and showing the main brain domains/nuclei according to the Zebrafish Brain Atlas from Wullimann et al. and were adapted from Menuet et al.84,85 Dm, medial zone of dorsal telencephalic area; LR, lateral recess of diencephalic nucleus; PCNA, Proliferating Cell Nuclear Antigen; PPa, parvocellular preoptic nucleus, anterior part; PPv, periventricular pretectal nucleus; PR, posterior recess of diencephalic ventricle. Color images are available online. PHENOTYPE:
|

DIO increases the occurrence of inactivity in zebrafish. (A–I) Graphs showing the number of inactivity, small and large activity events (left column); the duration of inactivity, small and large activity states (middle column) and the distance traveled in inactivity, small and large activity states (locomotion <4 mm/s) in DIO fish compared with controls. (J) Graph showing that the total distance traveled during 10 min is significantly reduced in DIO compared with CTRL fish. (K) Zebrafish path tracking in CTRL and DIO fish. n = 4 number of fish. Student's t-test: *p < 0.05. Error bar: SEM. PHENOTYPE:
|

DIO upregulates brain fkbp5 gene expression, a marker of glucocorticoid signaling. fkbp5 gene expression in CTRL and DIO brains. n = 3 pools of 2 brains. Bar graph: SEM. Student's t-test. |
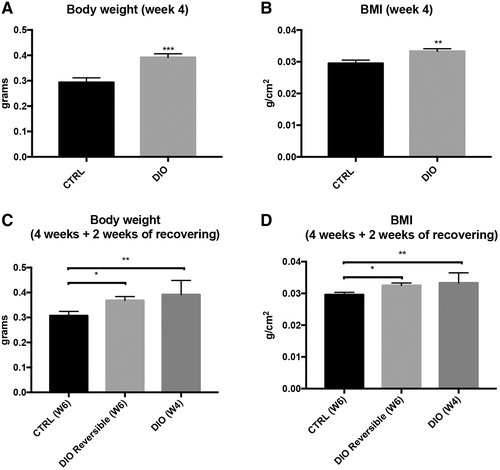
Switch from an overfeeding diet to a normal diet partially decreased body weight and BMI of DIO fish. (A) Body weight of CTRL and DIO zebrafish after 4 weeks of overfeeding. (B) BMI (g/cm2) after 4 weeks of overfeeding. (C, D) Body weight and BMI following 2 weeks of standard diet after the 4th week of overfeeding. These measurements were done at week 6 (W6: 4 weeks of overfeeding +2 weeks of normal diet). The DIO fish involved in this procedure were called “DIO Reversible” fish. n = 14–16. Error bars correspond to SEM. Student's t-test (A, B) and one-way ANOVA (C, D). *p < 0.0.5; **p < 0.01; ***p < 0.001. |
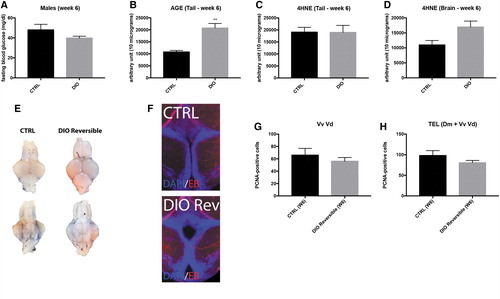
Switch from an overfeeding diet to a standard diet partially restores normal metabolic parameters and brain homeostasis. (A) Fasting blood glucose measurements at week 6 in CTRL and “DIO Reversible” fish (n = 10). (B, C) Graphs showing dot-blot quantification of peripheral AGE and 4-HNE levels (tail) of CTRL and “DIO Reversible” fish at week 6 (n = 4). (D) Graph showing dot-blot quantification of 4-HNE levels in the brain of CTRL and “DIO Reversible” fish at week 6 (n = 4, p = 0.051). (E) Representative dorsal (first row) and ventral (second row) view pictures of CTRL and “DIO Reversible” fish brains after Evans blue intraperitoneal injection at week 6 (n = 3). (F) Hypothalamic vibratome section showing no striking difference in Evans blue staining between CTRL and “DIO Reversible” fish (Red). (G, H) Statistical analysis of the PCNA-positive area in CTRL and “DIO Reversible” zebrafish in the ventral telencephalon (Vv Vd) and in the telencephalic region (Dm+Vv Vd; n = 3), showing no statistical difference in proliferation between groups. Bar graph: SEM. Student's t-test: **p < 0.01. n, number of fish. Color images are available online. |

Switch from an overfeeding diet to a standard diet partially restores normal behavioral activity in zebrafish. (A–I) Graphs showing the number of inactivity, small and large activity events (left column); the duration of inactivity, small and large activity states (middle column) and the distance traveled in inactivity, small and large activity states (locomotion <4 mm/s; right column) in “DIO Reversible” fish compared with controls. (J) Graph showing that the total distance traveled during 10 min is similar in DIO reversible compared with CTRL fish. (K) Zebrafish path tracking in CTRL and “DIO Reversible” fish. n = 6 number of fish. Student's t-test. Error bar: SEM. |