
Fig. 8
- ID
- ZDB-IMAGE-211116-8
- Publication
- Ghaddar et al., 2021 - Deleterious Effects of Overfeeding on Brain Homeostasis and Plasticity in Adult Zebrafish
- All Figures
- Figures for Ghaddar et al., 2021
|
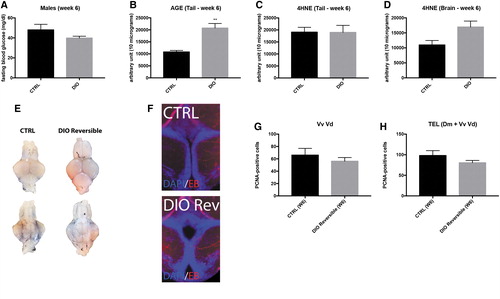
Fig. 8 Switch from an overfeeding diet to a standard diet partially restores normal metabolic parameters and brain homeostasis. (A) Fasting blood glucose measurements at week 6 in CTRL and “DIO Reversible” fish (n = 10). (B, C) Graphs showing dot-blot quantification of peripheral AGE and 4-HNE levels (tail) of CTRL and “DIO Reversible” fish at week 6 (n = 4). (D) Graph showing dot-blot quantification of 4-HNE levels in the brain of CTRL and “DIO Reversible” fish at week 6 (n = 4, p = 0.051). (E) Representative dorsal (first row) and ventral (second row) view pictures of CTRL and “DIO Reversible” fish brains after Evans blue intraperitoneal injection at week 6 (n = 3). (F) Hypothalamic vibratome section showing no striking difference in Evans blue staining between CTRL and “DIO Reversible” fish (Red). (G, H) Statistical analysis of the PCNA-positive area in CTRL and “DIO Reversible” zebrafish in the ventral telencephalon (Vv Vd) and in the telencephalic region (Dm+Vv Vd; n = 3), showing no statistical difference in proliferation between groups. Bar graph: SEM. Student's t-test: **p < 0.01. n, number of fish. Color images are available online.