
- Title
-
Pharmacological cholesterol depletion disturbs ciliogenesis and ciliary function in developing zebrafish
- Authors
- Maerz, L.D., Burkhalter, M.D., Schilpp, C., Wittekindt, O.H., Frick, M., Philipp, M.
- Source
- Full text @ Commun Biol
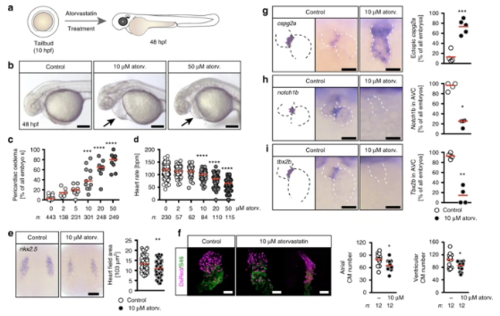
Atorvastatin dose-dependently affects heart formation and function. a Zebrafish embryos were treated from tailbud (tb) stage until 48 h post fertilization (hpf) with atorvastatin. bLive images of embryos treated either with vehicle (1% DMSO in egg water, Control), 10 or 50 µM atorvastatin. Arrows: pericardiac oedema. Scale bar: 200 µm. c Pericardiac oedema formation increases with increasing atorvastatin concentrations; n = 16 (0, DMSO), 6 (2 µM), 9 (5 µM), 11 (10 µM), 9 (20 µM), 9 (50 µM); ***p < 0.001, ****p < 0.0001 (atorvastatin versus DMSO control treated embryos), Kruska–Wallis test with Dunn’s multiple comparison test. d Heart rate gradually decreases with increasing concentrations of atorvastatin. Each circle is one embryo; n = 12 (0, DMSO), 4 (2 µM), 4 (5 µM), 5 (10 µM), 7 (20 µM), 6 (50 µM); ***p < 0.001, ****p < 0.0001 (atorvastatin versus DMSO control treated embryos), Kruskal–Wallis test with Dunn’s multiple comparison test. e Atorvastatin affects heart development at the level of cardiac progenitors. In situ hybridization at 8 somite stage (ss) for nkx2.5, which labels all cardiac progenitors. Scale bar: 100 µm; n = 3 with 72 embryos in total; p = 0.0013, two-tailed Mann–Whitney test. f Atorvastatin decreases the number of cardiomyocytes. 48 hpf zebrafish hearts expressing DsRed (shown in magenta) in all cardiomyocyte nuclei stained for atrial myosin (S46, green). Scale bar: 50 µm; *p = 0.0167 (atrial cardiomyocytes) and 0.0346 (ventricular cardiomyocytes), two-tailed t-test with Welch’s correction. g Valve formation is impaired upon atorvastatin treatment. The myocardial gene cspg2a is upregulated in atorvastatin embryos at 72 hpf. Red: mean; n = 4; p = 0.0040, two-tailed, t-test with Welch’s correction. h Endocardial notch1B, which is normally restricted to the atrioventricular canal, is expressed throughout the heart in atorvastatin-treated embryos (72 hpf); n = 4; *p = 0.0286, two-tailed, Mann–Whitney test. iAt 72 hpf, the expression of tbx2b, which is normally in the atrioventricular canal, is lost upon atorvastatin treatment. Red: mean; n = 4; **p = 0.0014, two-tailed, t-test with Welch’s correction. c, f–i Number of embryos given below graphs. c–e, g–i Red line indicates median if not otherwise indicated. g–i Scale bar: 50 µm EXPRESSION / LABELING:
PHENOTYPE:
|

Atorvastatin provokes ciliopathy phenotypes. a Atorvastatin treatment results in embryos with curved bodies. Scale bar: 200 µm. b Body curvature worsens with increasing atorvastatin concentrations; n = 16 (0, DMSO), 6 (2 µM), 8 (5 µM), 11 (10 µM), 9 (20 µM), 9 (50 µM); **p < 0.01, ****p < 0.0001 (atorvastatin versus DMSO control treated embryos), Kruskal–Wallis test with Dunn’s multiple comparison test. c Live images of otic placodes at 48 hpf showing defects in otolith formation in atorvastatin-treated embryos. Scale bar: 50 µm. d Graph displaying the dose-dependent increase in otolith defects upon atorvastatin treatment; n = 15 (0, DMSO), 6 (2 µM), 8 (5 µM), 10 (10 µM), 9 (20 µM), 9 (50 µM); *p < 0.05, ****p < 0.0001 (atorvastatin versus control treated embryos), Kruskal–Wallis test with Dunn’s multiple comparison test. e Atorvastatin produces random heart looping. Images of cmlc2 in situ hybridization to visualize the whole heart at 48 hpf. Scale bar: 100 µm; n = 9 (0, DMSO), 6 (2, 5, 10, 20 and 50 µM); p = 0.0065 (2 µM), 0.0073 (5 µM), 0.0005 (10 µM), < 0.0001 (20 and 50 µM). f Pancreas placement becomes randomized upon atorvastatin treatment. Dorsal views of embryos processed by in situ hybridization for the endocrine pancreas marker insulin (ins). Dashed line indicates midline of embryo. Scale bar 200 µm. Stacked bar graph summarises 9 (DMSO) and 6 (atorv. concentrations) experiments; p = 0.0492 (2 µM), 0.0493 (5 µM), 0.0002 (10 µM), < 0.0001 (20 and 50 µM). g The leftward gene lefty2 is ambiguously expressed after atorvastatin treatment. L expression on left side, R right side, B both sides of midline (dashed), A absent expression. Scale bar: 200 µm; **p = 0.0072. h pitx2 is randomly expressed in the left and/or right lateral plate mesoderm after atorvastatin treatment. L expression on left side, R right side, B both sides of midline (dashed), A absent expression. Scale bar: 200 µm; *p = 0.0155, **p = 0.0071. b, d–h Number of individual embryos given below or next to graphs. e–h Two-tailed Fisher’s exact tests (atorvastatin versus control treated embryos) |
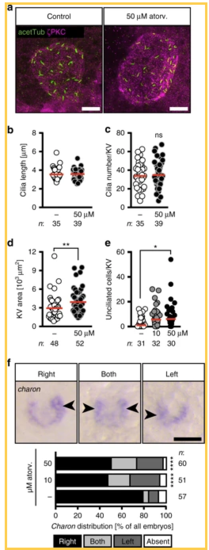
Atorvastatin impacts on the development of the temporal organ of laterality. a Confocal stacks of 6–8 somite stage (ss) Kupffer’s vesicle (KV). Cilia were stained with an antibody against acetylated tubulin (acetTub, green). Apical cell membranes to visualize the KV outline were stained with an antibody against atypical PKC (PKCζ, magenta). Scale bar: 20 µm. b Bar graph displaying the length of KV cilia in control and atorvastatin-treated embryos; n = 1231 (DMSO) and 1424 (50 µM atorv.) cilia; p = 0.6357, two-tailed Mann–Whitney test. c Cilia number per KV was not changed in the presence of atorvastatin; p = 0.6861, two-tailed t-test with Welch’s correction. d KV area was larger upon atorvastatin treatment. Each circle is one KV and embryo. ** p=0.0034. Two-tailed Mann–Whitney test. e Atorvastatin-treated embryos have more unciliated cells in the KV than control embryos. Cilia were stained using anti-acetylated antibody and KV cells were counted using the Sox17-GFP line. KV cells express high levels of GFP and can be distinguished from surrounding cells outside the KV. Each circle symbolizes one embryo; *p = 0.0375, Kruskal–Wallis test with Dunn’s multiple comparison test. f Atorvastatin disturbs correct spatial expression of charon. Representative images of in situ hybridization for charon at 10 ss with correct strong expression on right side and aberrant strong expression on both sides or left side (expression indicated by arrowheads; absent expression not shown). Scale bar: 50 µm. Stacked bar graphs summarises three experiments. Fisher’s exact test; n = 57 (DMSO), 51 (10 µM atorvastatin) and 60 (50 µM atorvastatin); ****p < 0.0001 for DMSO vs 10 µM as well as vs 50 µM. b–f Numbers of embryos analysed indicated below or next to graphs EXPRESSION / LABELING:
PHENOTYPE:
|

Cholesterol depletion alters phosphoinositide levels at the base of the cilium. a Confocal stacks of cilia showing Rab8-positive vesicles at the base of the cilium of human fibroblasts. Cilia were stained with an antibody against acetylated tubulin (acetTub, magenta). Vesicles are labelled in green (Rab8). Scale bar: 4 µm. b Distribution of Rab8 vesicle content at the base of the cilium between control treated and atorvastatin-treated human fibroblasts. Means ± SEM; n = 3 independent experiments. c Confocal stacks showing lack of Pi(4,5)P2 (magenta) at the base of cilia, when cells were treated with atorvastatin during ciliogenesis. Cilia were labelled with an antibody against Arl13B (green). Scale bar: 4 µm. d Analysis of five independent experiments revealed a significant reduction of cells exhibiting Pi(4,5)P2 at the base of the cilium. Each circle indicates the percentage of cells having Pi(4,5)P2 at the base of the cilium in one experiment. Means ± SEM; n = 5 with 181–202 cilia in total; *p = 0.0269, two-tailed t-test with Welch’s correction. e SLOS patient-derived fibroblasts exhibit less Pi(4,5)P2 at the base of the cilium. Means ± SEM; n = 4 with 154–156 cilia in total; **p = 0.0071, two-tailed t-test with Welch’s correction |

a, Zebrafish embryos were treated from tailbud stage until 48 hours post fertilization (hpf) with atorvastatin and water-soluble cholesterol. b, Live images of embryos treated either with vehicle (1% DMSO in egg water, Control), 10 μM atorvastatin or 10 μM atorvastatin together with 10 μM cholesterol. Arrows indicate pericardiac cavity, which is less dilated upon cholesterol reconstitution. Scale bar: 200 μm. c, Formation of pericardiac oedema is partly rescued after cholesterol supplementation. n=3 experiments. * p=0.0239, *** p=0.0003. One-way ANOVA with Sidak’s post-test. d, Heart rate significantly increases by co-administering cholesterol to atorvastatin-treated fish. n=3 experiments, each circle is one embryo.. ** p=0.0056, **** p<0.0001. Kruskal-Wallis test with Dunn’s multiple comparison test. Red line: median. Number of embryos given below graphs. |
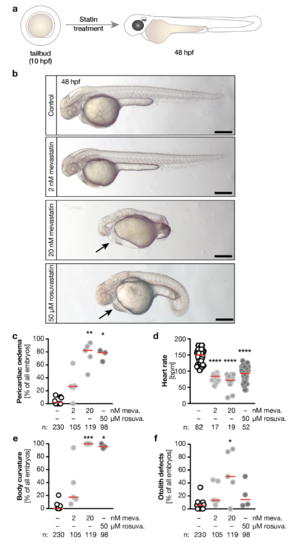
a, Zebrafish embryos were treated from tailbud stage until 48 hpf with mevastatin or rosuvastatin. b, Live images of embryos treated either with vehicle (1% DMSO in egg water, Control), 2 or 20 nM mevastatin and 50 μM rosuvastatin. Arrow indicates pericardiac oedema. Scale bar: 200 μm. c, The formation of pericardiac oedema upon statin treatment. * p=0.0187, ** p=0.0011. d, Heart rate decreases with statin treatment. **** p<0.0001. e, Meva- and rosuvastatin produce curved bodies. * p=0.0300, *** p=0.0003. f, Meva- and rosuvastatin treatment also results in otolith defects. * p=0.0309. Number of embryos given below graphs. Red line indicates median. c, e and f, number of experiments: 9 (DMSO), 5 (meva.) and 4 (rosu.) c-f, Kruskal-Wallis test with Dunn’s multiple comparison test. Statin vs. respective statin. |
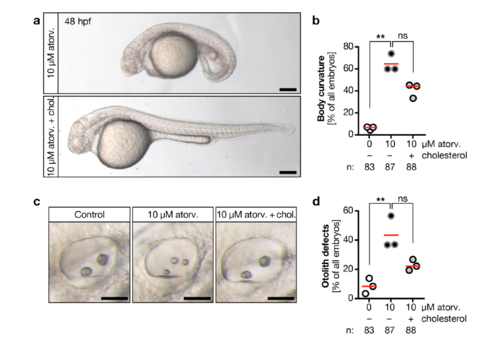
a, Atorvastatin treatment results in embryos with curved bodies, which can be rescued by cholesterol. Live images at 48 hpf. Scale bar: 200 μm. b, Body curvature worsens by atorvastatin treatment and is improved upon cholesterol replenishment. Red line: median. n=3 experiments. *** p=0.0044, ns=0.0824, Kruskal-Wallis test with Dunn’s multiple comparison test. c, Live images of otic placodes at 48 hpf showing defects in otolith formation in atorvastatin treated embryos and regular otolith seeding in embryos co-treated with cholesterol. Scale bar: 50 μm. d, Graph displaying the percentage of otolith defects upon atorvastatin and concomitant cholesterol treatment and. Red line: median. n=3 experiments. * p=0.0295, ns: p=0.3125, Kruskal-Wallis test with Dunn’s multiple comparison test. |

a, Pravastatin and rosuvastatin interfere with heart looping. In addition, cardia bifida could be observed. In situ hybridization for cardiac myosin light chain 1 (cmlc2). Scale bar: 100 μm. *p=0.0165 (20 μM prava.), **p=0.0087 (50 μM prava), ****p<0.0001. Two-tailed Fisher’s exact tests (all compared to DMSO-treated controls). b, Pancreas placement is also randomized by treatment with other statins. **p=0.0023, ***p=0.0001, ****p<0.0001.Stacked bar graphs summarize data of 4 experiments with 123 (DMSO), 97 (20 μM pravastatin), 90 (50 μM pravastatin) and 91 (50 μM rosuvastatin) embryos. |
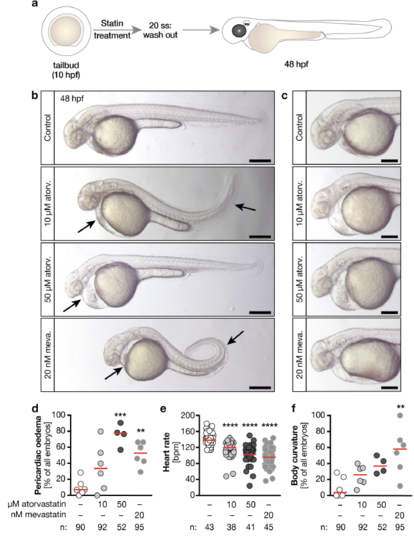
Statin treatment during LR asymmetry determination is sufficient to produce ciliopathy defects a, Zebrafish embryos were treated from tailbud stage until the 20 somites stage (ss) with atorvastatin or mevastatin. After washout of the drugs embryos were incubated until the 48 hpf stage. b, Live images of 48 hpf embryos treated either with vehicle (1% DMSO in egg water, Control), 10 or 50 μM atorvastatin or 20 nM mevastatin. Arrows indicate pericardiac oedema and curved tails. Scale bar: 200 μm. c, Live images of pericardiac oedema in higher magnification. Scale bar: 200 μm. d, The formation of pericardiac oedema increases with atorvastatin and mevastatin treatment. n=6 (DMSO, 10 μM atorv., 20 nM mevastatin) and 4 (50 μM atorv.) experiments. ** means p<0.01, *** indicates p<0.001. One-way ANOVA with Bonferroni's multiple comparisons test. e, Heart rate is also decreased when statins are only administered during left-right (LR) asymmetry cilia stages. **** p<0.0001, Kruskal-Wallis test with Dunn’s multiple comparison test. f, Mevastatin produces curved bodies. n=6 (DMSO, 10 μM atorv., 20 nM mevastatin) and 4 (50 μM atorv.) experiments. ** indicates p<0.001, Kruskal-Wallis test with Dunn’s multiple comparison test. d - f, circles: individual embryos (e) or experiments (d, f), red line: median. 7 Number of embryos given below graphs. |