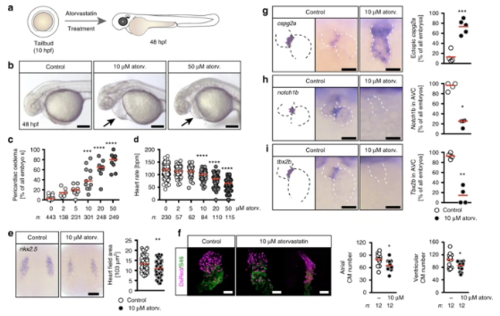
Atorvastatin dose-dependently affects heart formation and function. a Zebrafish embryos were treated from tailbud (tb) stage until 48 h post fertilization (hpf) with atorvastatin. bLive images of embryos treated either with vehicle (1% DMSO in egg water, Control), 10 or 50 µM atorvastatin. Arrows: pericardiac oedema. Scale bar: 200 µm. c Pericardiac oedema formation increases with increasing atorvastatin concentrations; n = 16 (0, DMSO), 6 (2 µM), 9 (5 µM), 11 (10 µM), 9 (20 µM), 9 (50 µM); ***p < 0.001, ****p < 0.0001 (atorvastatin versus DMSO control treated embryos), Kruska–Wallis test with Dunn’s multiple comparison test. d Heart rate gradually decreases with increasing concentrations of atorvastatin. Each circle is one embryo; n = 12 (0, DMSO), 4 (2 µM), 4 (5 µM), 5 (10 µM), 7 (20 µM), 6 (50 µM); ***p < 0.001, ****p < 0.0001 (atorvastatin versus DMSO control treated embryos), Kruskal–Wallis test with Dunn’s multiple comparison test. e Atorvastatin affects heart development at the level of cardiac progenitors. In situ hybridization at 8 somite stage (ss) for nkx2.5, which labels all cardiac progenitors. Scale bar: 100 µm; n = 3 with 72 embryos in total; p = 0.0013, two-tailed Mann–Whitney test. f Atorvastatin decreases the number of cardiomyocytes. 48 hpf zebrafish hearts expressing DsRed (shown in magenta) in all cardiomyocyte nuclei stained for atrial myosin (S46, green). Scale bar: 50 µm; *p = 0.0167 (atrial cardiomyocytes) and 0.0346 (ventricular cardiomyocytes), two-tailed t-test with Welch’s correction. g Valve formation is impaired upon atorvastatin treatment. The myocardial gene cspg2a is upregulated in atorvastatin embryos at 72 hpf. Red: mean; n = 4; p = 0.0040, two-tailed, t-test with Welch’s correction. h Endocardial notch1B, which is normally restricted to the atrioventricular canal, is expressed throughout the heart in atorvastatin-treated embryos (72 hpf); n = 4; *p = 0.0286, two-tailed, Mann–Whitney test. iAt 72 hpf, the expression of tbx2b, which is normally in the atrioventricular canal, is lost upon atorvastatin treatment. Red: mean; n = 4; **p = 0.0014, two-tailed, t-test with Welch’s correction. c, f–i Number of embryos given below graphs. c–e, g–i Red line indicates median if not otherwise indicated. g–i Scale bar: 50 µm
|
