
- Title
-
Hemodynamic Forces Tune the Arrest, Adhesion, and Extravasation of Circulating Tumor Cells
- Authors
- Follain, G., Osmani, N., Azevedo, A.S., Allio, G., Mercier, L., Karreman, M.A., Solecki, G., Garcia Le�n, M.J., Lefebvre, O., Fekonja, N., Hille, C., Chabannes, V., Doll�, G., Metivet, T., Hovsepian, F., Prudhomme, C., Pichot, A., Paul, N., Carapito, R., Bahram, S., Ruthensteiner, B., Kemmling, A., Siemonsen, S., Schneider, T., Fiehler, J., Glatzel, M., Winkler, F., Schwab, Y., Pantel, K., Harlepp, S., Goetz, J.G.
- Source
- Full text @ Dev. Cell
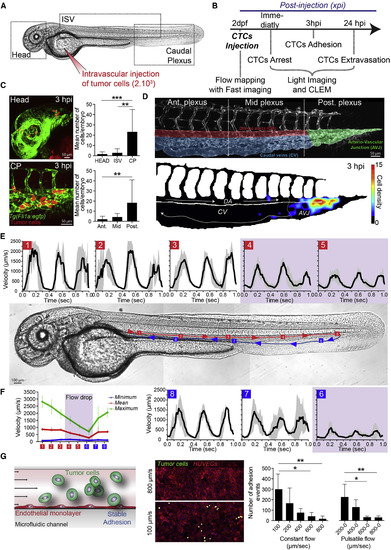
Arrest and Stable Adhesion of CTCs Are Favored by Permissive Blood Flow Profiles in the Zebrafish Embryo (A and B) Experimental design and workflow. xpi, min or hr post-injection (mpi) or (hpi). (C) Representative images (Head, head region; CP, caudal plexus) and quantification of arrested CTCs (red) in the vasculature (green) of the zebrafish embryo at 3 hpi (see also Video S1). Ant., Mid, and Post., anterior, mid, and posterior plexus as depicted in (D). (D) High-magnification image of the vascular CP, the associated regions, and heatmap of arrested CTCs at 3 hpi (n = 11 embryos). AVJ, arterio-venous junction; DA, dorsal aorta; CV, caudal veins. Arrows indicate blood flow direction. (E) Blood flow velocity measurements (PIV) in the indicated region (red and blue squares 1 to 8) of the zebrafish embryo. Arrows indicate blood flow direction (see also Videos S2 and S3). (F) Minimum, maximum, and mean values of the blood flow velocity are plotted over the eight different regions (n = 3 embryos). (G) Experimental setup, representative images, and quantification of the microfluidic approach. CTCs (green) are perfused over a monolayer of HUVECs (ECs, red) and adhesion is quantified (n = 5?6 independent channel per conditions). Pulsatile flow corresponds to 0.3 s perfusion/0.3 s stop of the peristaltic pump. Values are mean � SD. ?p < 0.05, ??p < 0.01, ????p < 0.0001. |

Arrest of CTCs Depends on Early Cellular Adhesion Forces (A) Quantification of the diameters of human CTCs (green, five breast cancer patients and one lung cancer patient) and 1675, D2A1, JIMT-1, A431, 4T1, and ZMEL1 cells (red) in suspension. Representative images of human CTCs and D2A1 are also provided. Human CTCs are labeled with pan-keratin (CTC marker), CD45, and DAPI (nucleus). (B) Representative confocal z projection image of the CP. Red shows highly perfused vessels with diameters over 10 ?m. (C) Quantification of the number of arrested cells per ISV in the yellow dashed region depicted in (B). (D) Quantification of the repartition of arrested cells in the plexus of 59 embryos, between the regions of bigger (red) and smaller (white) than 10 ?m vessels in diameter. (E) Experimental workflow and depletion of ITGB1 via small interfering RNA (siRNA) in D2A1 cells: control siRNA (siCTL) and two distinct sequences of the siRNA targeting ITGB1 (siITGB1 no. 1 and siITGB1 no. 2). Representative western blot images are shown. Heatmaps of arrested CTCs after 3 hpi are shown for CTCs transfected with siRNAs (n = 77, 63, and 55, respectively). Quantification of the ratio of arrested CTCs in the indicated region is provided. Norm., normalized to siCTL AVJ. (F) Graph depicts the number of adhesion events (CTCs to HUVECs) quantified in our microfluidic approach (see also Videos S6 and S7). Norm., normalized to siCTL. (G) Experimental setup of intravital CLEM performed on arrested CTCs only 15 mpi. Representative EM images of arrested CTCs (red) in vascular lumen (green) are provided from two different sections (top and bottom). A reconstruction of an electron tomogram is provided. The yellow outline highights the area quantified in (C). (H) Experimental setup, representative image, and quantification of optical tweezing experiments of arrested CTCs in the AVJ (n = 37 arrested cells, n > 10 embryos) (see also Video S7). Values are mean � SD. ?p < 0.05, ??p < 0.01, ???p < 0.001, ????p < 0.0001. |
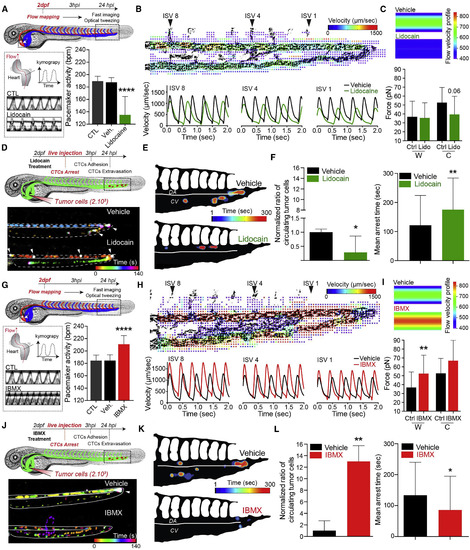
Modulating Blood Flow Forces Regulates Arrest of CTCs. (A?L) Zebrafish embryos were treated with vehicle, lidocain (A?F), or IBMX (G?L). (A and G) Experimental workflow. Heart PMA is quantified for each condition. CTL, breeding water. An additional kymograph analysis is provided. (B and H) top: images extracted from fast imaging and PIV analysis of the blood flow in the CP; region boxed in (A) and (G) (see also Video S8. Tuning the Blood Flow in the CP of 2-dpf Zebrafish Embryos, Related to Figure 3, Video S9., Video S10. Tuning and Measuring Hemodynamic Forces). Bottom: quantification of the flow profiles in the center of the DA analyzed at position ISV 8, ISV 4, and ISV1 (n = 4/5 embryos per condition). (C and I) Orthogonal flow velocity profile and quantification extracted from optical tweezing of RBCs in the DA under ISV 1 (W, wall; C, center) (see also Video S10). (D and J) Experimental workflow and representative images of the residency time of CTCs in the CP over a period of 5 min (see also Video S11). Arrowheads indicate long-lasting arrested cells (white). (E and K) Spatiotemporal quantification of the residency time of CTCs in the CP using heatmapping on a representative embryo. (F and L) Quantification of the ratio of CTCs as well as the mean arrest time over a period of 5 min for embryos treated with vehicle or the indicated drug. Norm., normalized to vehicle mean. Values are mean � SD. ?p < 0.05, ??p < 0.01, ????p < 0.0001. |
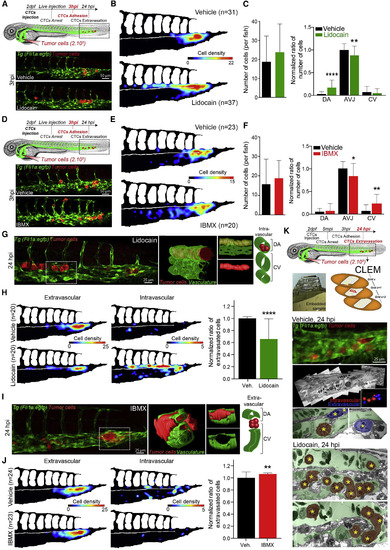
Modulating Blood Flow Forces Regulates Stable Adhesion and Extravasation of CTCs (A?J) Zebrafish embryos were treated with vehicle, lidocain (A?C and G?H) or IBMX (D?F and I?J). (A and D) Experimental workflow and representative images of arrested CTCs (red) in the CP (green) of vehicle- or drug-treated embryos. (B and E) Quantification of the number and location of arrested CTCs in the CP of 3 hpi vehicle- or drug-treated embryos, through heatmapping. (C and F) Quantification of the number of arrested CTCs per embryo as well as the ratio of arrested CTCs per region in vehicle- or drug-treated embryos, 3 hpi. Data normalized to vehicle AVJ mean ratio. (G and I) Representative images of TCs (red) in the CP (green) of 24 hpi vehicle- or drug-treated embryos are shown. 3D reconstruction and scheme of the boxed region is provided. (H and J) Quantification of the number and location of intra- and extravascular TCs in the CP of 24 hpi vehicle- or drug-treated embryos, through heatmapping and histograms. (K) Experimental workflow and CLEM analysis of 24 hpi vehicle- or lidocain-treated embryos is used for further assessing the vascular location of TCs (yellow stars) intravascular (red) or extravascular (blue) (see also Video S12). Values are mean � SD. ?p < 0.05, ??p < 0.01, ????p < 0.0001. |

Extravasation of CTCs Occurs via Flow-Dependent Endothelial Remodeling (A) Experimental workflow. (B) Extracted z projection image from 3D time-lapse analysis of the behavior of arrested TCs (red) in the CP vasculature (green) over a period of 15 hr (see also Video S13). (C) Multiple sequential images, over a period of 800 min, of the region boxed in (B) are displayed and commented (yellow arrowheads point to the location of the associated comment, left panel). (D) Multiple sequential images, over a period of 150 min, of the region boxed in (B) are displayed and commented (yellow arrowheads point to the location of the associated comment). (E) Experimental workflow and CLEM analysis of a 9-hpi vehicle-treated embryo. Extracted images of confocal analysis of extravasating TCs (red) at 9 hpi is performed. (F) Transmission electron microscopy (TEM) image of the region of interest boxed in (E), retrieved in the electron microscopy volume. A representative section is shown and color-coded for TCs (red) and vascular lumen (green) (see also Video S14). (G) 3D reconstruction of the serial section TEM performed over the entire regions of interest, depicting TCs (red) and associated ECs (green) (see also Video S14). (H) Electron tomography image extracted from 3D reconstruction over the boxed region in (F) (TC, red; ECs, green) (see also Video S14). (I) Representative images of TCs (red) and the associated vasculature (green) in 9 hpi embryos are shown. (J and K) Quantification and kinetic analysis of the mean number of events over time for vehicle- and lidocaine-treated embryos. The number of events (intravascular, pocketing, and extravascular) was quantified at 3, 9, and 24 hpi. (L) Experimental workflow and idealized representation (left). Embryos are injected with CTCs and 100-nm beads and imaged at high speed, before single-particle tracking analysis (middle). Corresponding quantification of tracks' straightness and velocity in three scenarios (open, partially closed, and closed) and in silico representation of laminar flow around arrested tumor cell (right). Values are mean � SD. ?p < 0.05. ns, not significant. |

CTCs arrest and extravasate in vascular regions with permissive flow profiles. (A) Experimental workflow. (B) Maximum projection of confocal stack of the zebrafish brain vasculature (green) containing extravasated TCs (red). (C) Heatmaps showing the adhesion pattern of 6 cell lines in the caudal plexus of the zebrafish embryos. (D) Confocal Z-projection of zebrafish posterior caudal plexus (CP) at 2 dpf. (E) Partial 3D segmentation (Amira) based on confocal acquisition (D). (F) Simplified AOC model of the zebrafish CP. (G) Image extracted from Movie S3, showing flow simulation results in the AOC model. (H) Velocity profiles obtained from flow simulation at several positions indicated in F. (I) Graphical representation of minimum, maximum and mean values of the blood flow velocity over the 5 positions from F. |

Permissive flow profiles allow adhesion of CTCs to ECs. (A) Experimental set up, representative image and quantifications of the 10-?m beads injection. (B) Experimental set up and results of the adhesion efficacy regarding the temperature. (C) Experimental set up and quantification of the measured adhesion rupture force (n=8 and 6) of attached TC (top). Annotated image sequence from Movie 6 showing the detachment of a TC from the endothelial monolayer (bottom). (D) Experimental set up and quantification of the ratio of effective adhesion events upon OT (left) and OT-mediated detachment events (right) using siRNA-treated TCs. (E) Quantification of the Western blot analysis in Fig.2E and representative immunostaining images from siITGB1 cells. |

Flow tuning in vivo. (A) Experimental workflow, and a representative image of the PIV analysis in the CP. Quantification of the duration of the flow under 400 ?m/sec for each pharmacological condition in the dorsal aorta (position ISV 1, 4 and 8 from A) (n = 4 to 5 embryos per condition). (B) Experimental workflow of OT-mediated quantification of hemodynamic forces in vivo and annotated image showing trapped RBC in the DA (yellow) (see also Movie 11). Quantification and mapping of the flow force measured with OT on trapped RBCs for 3 conditions: lidocain, IBMX and control (breeding water). Values in A are mean + SD. (C and E) Image extracted from Movie 10, showing flow simulation results in the AOC model for vehicles and lidocain (C) or IBMX (E). (D and F) Velocity profiles from flow simulation at several positions for each condition (as shown in Fig.S1F). |

Blood flow tuning does not affect the architecture of the caudal plexus or tumor cells ability to migrate and adhere. (A) 3D segmentation (IMOD) from one zebrafish posterior caudal plexus per condition (See also Movie 12). (B) Total vascular surface from dorsal aorta (DA, red on A) and caudal veins (CV, blue on A) for each condition (n=3). (C) Number of vascular loops for each condition (n=3). (D) Representative images of embryos injected with dextran 500kDa and imaged 3 hpi are shown (E) Representative images of wound closure for each condition 0, 9 and 24 hours after wound. (F) Wound closure over time (n=3). (G) Representative image of TC stained with crystal violet during the adhesion test (left). Absorbance measured at 590nm (right). (H) Number of adhesion events per field after 10 min of perfusion of tumor cells in each condition using the microfluidic channels. (I) Number of extravasated cells 16 hours post-perfusion of tumor cells (10min), with or without flow, in the microfluidic channels in each condition. In vitro experiment were done at least 3 times, in triplicate. Values in (B-C), (F-G) and (H,I) are mean + SD. |

Tuning PMA with two other drugs also perturb the behavior of CTCs in vivo. (A) Quantification of the PMA with nifedipin (5?M) treatment compared to vehicle. (B) Number and location of arrested CTCs 3hpi using heatmapping, and quantification (C). (D) Adhesion and migration assay results of TCs assessed in presence of nifedipin. (E) Quantification of the PMA with norepinephrine (500?M) treatment compared to control. (F) Number and location of arrested CTCs 3hpi using heatmapping, and quantification (G). Data normalized to vehicle AVJ mean. (H) Adhesion and migration of TCs is assessed in presence of norepinephrine. (I) Heatmaps and quantification of the extravasation efficacy of 1675, JIMT-1 and ZMEL cells 24 hpi. Values in (A), (C-F), (H-J) and (I) are mean + SD. |

Flow profiles around (and close to) arrested tumor cells in the zebrafish embryo. (A) Scheme depicting flow profiles around arrested TC in the zebrafish embryo (Open, partially clogged and clogged) and quantification of the distance between arrested TC and the first fully perfused vessel (B) Images of in silico simulations for the respective scenario (C) Images and analysis of high-speed confocal acquisitions in the zebrafish embryo. Values in (A) are mean �SD. |
Reprinted from Developmental Cell, 45, Follain, G., Osmani, N., Azevedo, A.S., Allio, G., Mercier, L., Karreman, M.A., Solecki, G., Garcia Le�n, M.J., Lefebvre, O., Fekonja, N., Hille, C., Chabannes, V., Doll�, G., Metivet, T., Hovsepian, F., Prudhomme, C., Pichot, A., Paul, N., Carapito, R., Bahram, S., Ruthensteiner, B., Kemmling, A., Siemonsen, S., Schneider, T., Fiehler, J., Glatzel, M., Winkler, F., Schwab, Y., Pantel, K., Harlepp, S., Goetz, J.G., Hemodynamic Forces Tune the Arrest, Adhesion, and Extravasation of Circulating Tumor Cells, 33-52.e12, Copyright (2018) with permission from Elsevier. Full text @ Dev. Cell