
Fig. 1
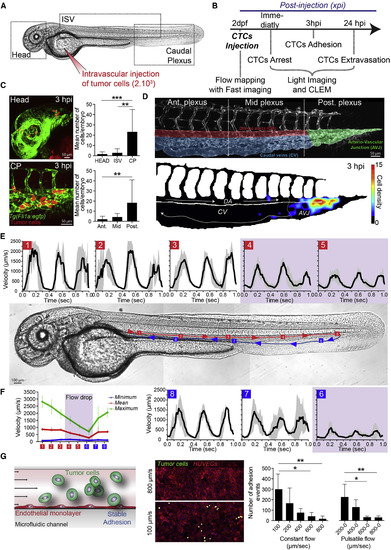
Arrest and Stable Adhesion of CTCs Are Favored by Permissive Blood Flow Profiles in the Zebrafish Embryo (A and B) Experimental design and workflow. xpi, min or hr post-injection (mpi) or (hpi). (C) Representative images (Head, head region; CP, caudal plexus) and quantification of arrested CTCs (red) in the vasculature (green) of the zebrafish embryo at 3 hpi (see also Video S1). Ant., Mid, and Post., anterior, mid, and posterior plexus as depicted in (D). (D) High-magnification image of the vascular CP, the associated regions, and heatmap of arrested CTCs at 3 hpi (n = 11 embryos). AVJ, arterio-venous junction; DA, dorsal aorta; CV, caudal veins. Arrows indicate blood flow direction. (E) Blood flow velocity measurements (PIV) in the indicated region (red and blue squares 1 to 8) of the zebrafish embryo. Arrows indicate blood flow direction (see also Videos S2 and S3). (F) Minimum, maximum, and mean values of the blood flow velocity are plotted over the eight different regions (n = 3 embryos). (G) Experimental setup, representative images, and quantification of the microfluidic approach. CTCs (green) are perfused over a monolayer of HUVECs (ECs, red) and adhesion is quantified (n = 5–6 independent channel per conditions). Pulsatile flow corresponds to 0.3 s perfusion/0.3 s stop of the peristaltic pump. Values are mean ± SD. ∗p < 0.05, ∗∗p < 0.01, ∗∗∗∗p < 0.0001. |
Reprinted from Developmental Cell, 45, Follain, G., Osmani, N., Azevedo, A.S., Allio, G., Mercier, L., Karreman, M.A., Solecki, G., Garcia Leòn, M.J., Lefebvre, O., Fekonja, N., Hille, C., Chabannes, V., Dollé, G., Metivet, T., Hovsepian, F., Prudhomme, C., Pichot, A., Paul, N., Carapito, R., Bahram, S., Ruthensteiner, B., Kemmling, A., Siemonsen, S., Schneider, T., Fiehler, J., Glatzel, M., Winkler, F., Schwab, Y., Pantel, K., Harlepp, S., Goetz, J.G., Hemodynamic Forces Tune the Arrest, Adhesion, and Extravasation of Circulating Tumor Cells, 33-52.e12, Copyright (2018) with permission from Elsevier. Full text @ Dev. Cell