
- Title
-
ATF4 overexpression induces early onset of hyperlipidaemia and hepatic steatosis and enhances adipogenesis in zebrafish
- Authors
- Yeh, K.Y., Lai, C.Y., Lin, C.Y., Hsu, C.C., Lo, C.P., Her, G.M.
- Source
- Full text @ Sci. Rep.

Generation and characterization of zebrafish transgenic ATF4 lines (ATs). (A) The transgenic construct, pβ-Act-Tetoff-ATF4-2A-mCherry. (B) Immunoblot analysis of ATF4 expression in AT1 and AT2 fish. Control: wild type (WT). (C) AT1 and WT without Dox treatments (−Dox, panels 1 and 3, 40X magnification, scale bars: 200 μm), and AT1 and WT with (+Dox, panels 2 and 4, 40X magnification, scale bars: 200 μm). EXPRESSION / LABELING:
|
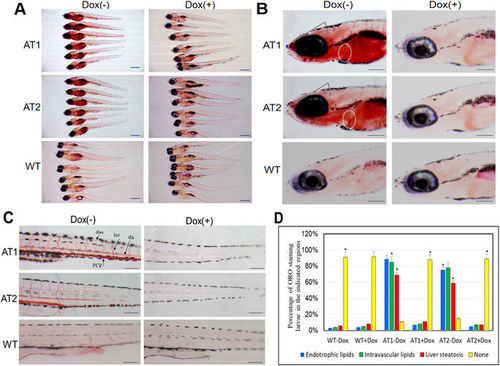
Induction of endotrophic and intravascular lipid accumulation in larval ATs. (A) Whole-mount ORO staining of 9-days post fertilization (dpf) ATs ± Dox and WT ± Dox larvae (32X magnification, scale bars: 200 μm). (B) Enlargement at the brain region in (A) shown lipid accumulation in brain and heart. ORO stained brain regions are indicated by the arrows. Hearts are circled (110X magnification, scale bars: 200 μm). (C) Enlargement at the posterior level in (A) shown intravascular lipid accumulation (110X magnification, scale bars: 200 μm). (D) Cumulative percentage of ORO staining zebrafish larvae in the indicated regions. Statistical analyses of ATs ± Dox and WT ± Dox larvae with liver steatosis and intravascular lipids was calculated through ORO staining at 9 dpf. The ORO staining were performed in triplicate with on average 60–80 larvae per groups (WT-Dox, WT + Dox, AT1-Dox, AT1 + Dox, AT2-Dox, and AT1 + Dox). The asterisk represents statistically significant differences; *p < 0.01, and **p < 0.005. Abbreviations: da, dorsal aorta; dlav, dorsal longitudinal anastomotic vessel; isv, intersegmental vessel; pcv, posterior cardinal vein. PHENOTYPE:
|

ZFIN is incorporating published figure images and captions as part of an ongoing project. Figures from some publications have not yet been curated, or are not available for display because of copyright restrictions. |
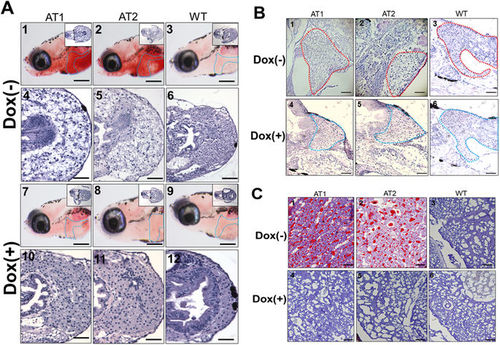
Histological changes in livers of ATs − Dox larvae and juvenile ATs (<30 days post fertilization (dpf)) at different quantities of feeding and lipid contents. (A) Whole-mount ORO staining in the liver region of AT1 ± Dox (panels 1 and 7), AT2 ± Dox (panels 2 and 8), and WT ± Dox (panels 3 and 9) larvae at 10 dpf (110X magnification, scale bars: 100 μm). Livers are circled. H&E staining in the liver of AT1 ± Dox (panels 4 and 10), AT2 ± Dox (panels 5 and 11), and WT ± Dox (panels 6 and 12) larvae. (400X magnification, scale bars: 200 μm) (B) H&E staining in the liver region of juvenile (28 dpf) AT1 ± Dox (panels 1 and 4), AT2 ± Dox (panels 2 and 5), and WT ± Dox (panels 3 and 6). Livers are circled. 200X magnification, scale bars: 200 μm (C) Frozen section ORO staining (frozen ORO) in the liver of juvenile (28-dpf) AT1 ± Dox (panels 1 and 4), AT2 ± Dox (panels 2 and 5), and WT ± Dox (panels 3 and 6). 400X magnification. Scale bars: 10 μm. PHENOTYPE:
|

ATF4 overexpression sensitizes zebrafish to oxidative stress induced by a HFD and induces NASH. (A) Levels of hepatic MDA, and (B) H2O2 in hepatic mitochondria was compared between AT1 ± Dox and WT ± Dox adults fed a HFD or LFD for 4 weeks. (C) Representative histological analysis of livers from the AT1 ± Dox and WT ± Dox adults that were fed a HFD or LFD for 4 weeks (400X magnification, scale bars: 10 μm). (D) Molecular analysis of AT1-Dox NASH-like livers revealed the upregulation of inflammatory genes, il-1b, il-6, tnf-α, ifn-γ, nfkb2, and NF-kB. (E) Molecular analysis of AT1-Dox NASH-like livers revealed the upregulation of ER stress markers, atf6, ern2, ire1, prek, hspa5, grp78, and ddit3. The biochemical analysis of oxidative stress were performed in triplicate in (A,B) and prepared from average 2–3 eight months male–female fish pairs per groups (WT-Dox, WT + Dox, AT1-Dox, AT1 + Dox). The qRT-PCRs were performed in triplicate in (D,E). Expression analysis of the selected genes using cDNA prepared from average 2–3 eight months male–female fish pairs per groups (WT-Dox, WT + Dox, AT1-Dox, AT1 + Dox). Levels of mRNA were normalized to β-actin and expressed as fold of values in the WT-Dox control. The asterisk represents statistically significant differences; *p < 0.01, and **p < 0.005. |
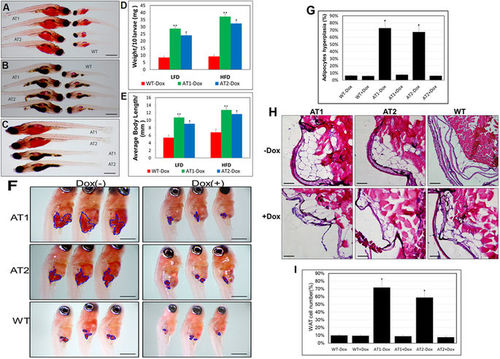
ATF4 overexpression results in enhancement of ATs larval growth and adipocyte formation (A) Length comparison of ATs − Dox and WT-Dox larvae fed a HFD for two weeks. (32X magnification, scale bars: 200 μm). (B) Length comparison of ATs − Dox and WT-Dox larvae fed a low-fat diet (LFD) for two weeks (32X magnification, scale bars: 200 μm). (C) Length comparison of ATs − Dox larvae fed a HFD or LFD for two weeks (32X magnification, scale bars: 200 μm). (D) Average body weights of ATs − Dox and WT − Dox larvae fed a LFD or HFD (n = 40–50 for each groups). (E) Average body lengths of ATs − Dox and WT − Dox larvae fed a LFD or HFD (n = 40–50 for each groups). (F) ORO-stained visceral adipocytes in ATs − Dox compared to control zebrafish at 24 dpf (40X magnification, scale bars: 200 μm). Visceral adipocytes are circled. (G) The percentage of zebrafish larvae containing hyperplasia of visceral adipocytes (n = 40–50 for each groups). (H) ATF4 overexpression leads to adipocyte hyperplasia. H&E stain of the abdominal white adipose tissue (WAT) sections from 24 dpf ATs ± Dox and WT ± Dox fed a HFD for 2 weeks (400X magnification, scale bars: 10 μm). (I) The percentage of cell number in intra-abdominal fat pads of 24 dpf ATs ± Dox and WT ± Dox fed a HFD for 2 weeks (n = 10–15 for each groups). The asterisk represents statistically significant differences; *p < 0.01, and **p < 0.005. PHENOTYPE:
|
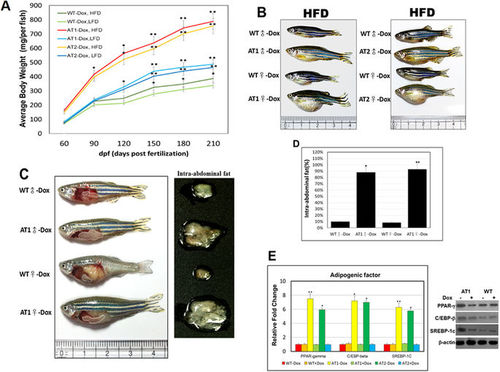
ATF4 overexpression induces weight gain and increases fat mass. (A) ATs were fed either a LFD or HFD for the indicated time periods. Serial body weight of each zebrafish was monitored monthly (n = 20–25). *p < 0.01, and **p < 0.005. (B) Representative images of male and female ATs − Dox and WT-Dox fed either a HFD for 5 months. (C) ATF4 overexpression leads to greater intra-abdominal fat (left), and the increased intra-abdominal fat pad size is shown (right). (D) Nuclear magnetic resonance intra-abdominal fat analyses of 10-month-old HFD–fed WT-Dox and AT1-Dox. Examined fish was prepared from 5–8 four months male–female fish pairs of each indicated groups fed either a HFD for 6 months. The asterisk represents statistically significant differences; *p < 0.01, and **p < 0.005. (E) Expression of adipogenic genes and proteins. PPAR-γ, C/EBP-β, and SREBP-1c mRNA (left, qRT-PC), and proteins (right, western blot). The qRT-PCRs were performed in triplicate in (E). Expression analysis of the selected genes using cDNA prepared from average 2–3 eight months male–female fish pairs per groups. Levels of mRNA were normalized to β-actin and expressed as fold of values in the WT-Dox control. The asterisk represents statistically significant differences; *p < 0.01, and **p < 0.005. |